When the NBA entered its annual All-Star break, I started work on a piece intended to look at how teams similar to this year’s Wizards throughout league history fared when they reached the playoffs. At the time, Washington was 33-21, and their Simple Rating System (SRS) — a measure of team strength that combines scoring differential with strength of schedule — was +1.67 per game.
In the six games they’ve played since the break, they faced opponents with a combined scoring differential of -1.15. Even an average team would have been expected to win four of the six. The Wizards went 1-5 and were outscored by a whopping 86 points. That’s 14.3 points per game. Even if I throw out the 38-point loss to Cleveland as an aberration, Washington lost the other five by 9.6 points per game. Their SRS now stands at -0.02.
All season, I’ve been writing variations on the theme of “The Wizards Just Ain’t That Good,” but I’m still surprised by their catastrophic collapse since the All-Star break. What’s scary: their remaining 22 games don’t look as easy as they did just a few weeks ago.
Fourteen of their remaining contests are against likely playoff teams. And, the key statistical indicators of team strength I watch are all dipping. This recent stretch of horrific basketball could merely be a rough patch for an average team, but it could also be a signal of an aging group that’s about to flat line.
When I run the numbers through my “who’s gonna win” machine, the results are…well…bad. In a worst-case scenario, the Wizards would limp into the playoffs with just seven wins over their last 22. I think they’ll be better than that, but it’s hard to find more than 11 wins the rest of the way (which, by the way, would give them a final record of 45-37, which happens to be what I projected for them back in October). Barring a miracle about-face, those dreams of a 50-win season will remain just that.
As long as I’m fretting, here’s another reason for Wizards fans to be concerned: this interview of team president Ernie Grunfeld by radio guy Dave Johnson. Presented with respectful softball questions by Johnson, Grunfeld offered his thoughts on how his team could pull out of its skid — and thoroughly misdiagnosed what’s wrong.
In the interview, Grunfeld suggested the team’s biggest problem has been a decline in their defense. He said their results will improve when they play better defense, get out on the fast break and “compete” on a nightly basis.
Here’s a look at the Wizards pre- and post-All-Star break:
| TIME |
PACE |
ORTG |
DRTG |
| Pre-ASB |
93.5 |
105.4 |
102.9 |
| Post-ASB |
96.7 |
93.4 |
108.3 |
| CHANGE |
3.2 |
-11.9 |
-5.4 |
What the numbers show is that the Wizards have played faster since the All-Star break, but have been worse. Grunfeld gets partial credit on the “play better defense” portion of his prescription since that would be a good thing to do. However, The drop in offensive efficiency is more than double their change in defensive efficiency. That means the team’s struggles are first and foremost because of its offense.
In case you were wondering, forgetting the debacle against Cleveland doesn’t change the analysis. Their defense the past three games has been excellent and yet they lost two because their offense was a horror show. If the Wizards want to start winning, they do need to get better on both ends, but their most important fix will be on offense.
There’s another issue with Grunfeld’s prescription — the data show the team’s offensive and defensive efficiency are uncorrelated. I’ve been tracking offensive and defensive efficiency by pace for years now, and this season’s result is the same as every other year. Good defense doesn’t cause good offense. Good offense doesn’t cause good defense. It’s almost as if offense and defense occur at different ends of the floor.
This season, if the numbers suggest anything it’s the Wizards show a very slight tendency to play better defense when they’re worse on offense. In terms of pace effects, Washington has a very slight tendency to play worse on offense in faster-paced games. But these “effects” are so small they’re basically meaningless.
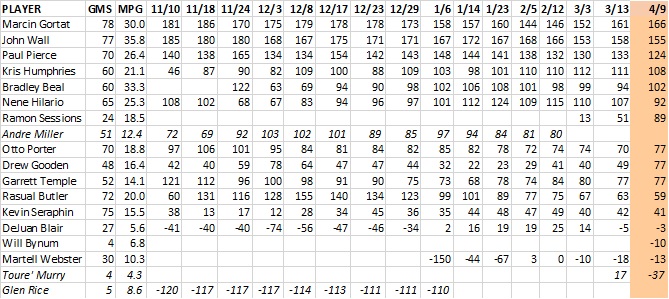
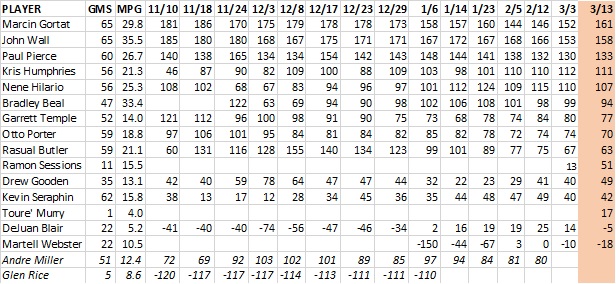
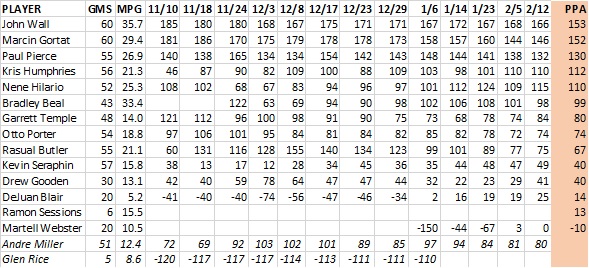
Player Production Average Update
Player Production Average (PPA) is an overall rating stat I developed that credits players for things they do that help a team win and debits them for things that hurt the cause. PPA is pace neutral, accounts for defense, and includes a “degree of difficulty” factor based on the level of competition a player faces while on the floor. In PPA, 100 = average, higher is better and replacement level is 45.
The numbers under each date represent the player’s PPA for the entire season to that date. The number in the far right column (labeled PPA) is the player’s current PPA through games played last night. For a look at how players on other teams rate, visit here.

My apologies for the format. The spreadsheet has reached a width that WordPress struggles to accommodate.
Early returns on the Andre Miller for Ramon Sessions trade aren’t good. As the table above shows, Miller had a PPA of 80 with the Wizards; Sessions has managed a Maynor-esque 13 so far. Meanwhile, Miller’s PPA with the Kings is a robust 90 (good for a backup PG). Sessions in Sacramento posted a 16 PPA.
Unsurprisingly for a team that barely ended a five-game losing streak, production for most guys was down. The biggest decliner was John Wall, but he was hardly alone. The team also saw drop-offs from Nenê, Garrett Temple, Rasual Butler, and Kevin Seraphin.
Perhaps the Wizards can turn things around, but it’s an old team that doesn’t have a ton of upside. Over the season’s final 22 contests, Wall will likely play more like he did earlier in the season, but it’s not realistic to think any of the team’s older players have much room for improvement. Maybe Beal or Porter can play better to close out the season, but neither looks ready to provide a surge in production.
Realistically speaking, if the Wizards can go .500 the rest of the way, I’d call it a success. But, winning just seven or eight of their remaining 22 is a realistic possibility as well. That would leave them with 41 or 42 wins, which would almost certainly relegate them to the sixth seed. Where they’d probably draw Cleveland and get bounced from the playoffs in the first round.
So. Wizards.
 My 2015-16 Wizards preview is up at Vice Sports. I won’t steal my own thunder much, except to say that my projection approach says the Wizards will win 41-42 games this season. Not as encouraging as I’d hoped, and I had some mild surprises in the numbers — younger players not being predicted to improve as much as I’d have intuitively expected.