NBA Playoffs: PPA Update

Just numbers because…no time. This is through games played on May 10, 2015.

Player Production Average (PPA) is an overall rating stat I developed that credits players for things they do that help a team win and debits them for things that hurt the cause. PPA is pace neutral, accounts for defense, and includes a “degree of difficulty” factor based on the level of competition a player faces while on the floor. In PPA, 100 = average, higher is better and replacement level is 45.

Player POS Tm G MPG PPA
DeMarre Carroll SF ATL 9 35.2 212
Al Horford C ATL 9 32.2 182
Paul Millsap PF ATL 9 35.7 174
Kyle Korver SG ATL 9 38.2 147
Jeff Teague PG ATL 9 32.1 108
Shelvin Mack PG ATL 7 4.9 96
Mike Scott PF ATL 8 11.1 83
Mike Muscala PF ATL 3 8.0 66
Dennis Schroder PG ATL 9 17.9 63
Pero Antic PF ATL 9 16.7 34
Kent Bazemore SG ATL 9 17.7 32
John Jenkins SG ATL 2 2.5 -85
Elton Brand PF ATL 2 2.0 -212
Jae Crowder SF BOS 4 25.0 126
Jared Sullinger PF BOS 4 20.0 110
Tyler Zeller C BOS 4 22.5 85
Isaiah Thomas PG BOS 4 29.8 67
Marcus Smart PG BOS 4 22.5 57
Evan Turner SG BOS 4 29.5 50
Brandon Bass PF BOS 4 21.5 49
Avery Bradley SG BOS 4 33.3 23
Kelly Olynyk C BOS 4 13.3 20
Jonas Jerebko PF BOS 4 17.0 -13
Gerald Wallace SF BOS 1 4.0 -68
Luigi Datome SF BOS 3 4.7 -87
Phil Pressey PG BOS 2 2.5 -158
Brook Lopez C BRK 6 39.0 166
Alan Anderson SG BRK 6 23.7 122
Joe Johnson SG BRK 6 41.5 103
Jarrett Jack PG BRK 6 25.5 94
Deron Williams PG BRK 6 32.0 87
Markel Brown SG BRK 2 5.0 68
Thaddeus Young PF BRK 6 31.7 55
Bojan Bogdanovic SF BRK 6 34.3 48
Mason Plumlee C BRK 6 8.2 30
Earl Clark PF BRK 2 6.5 -47
Darius Morris PG BRK 1 5.0 -84
Mirza Teletovic PF BRK 3 5.3 -115
Jerome Jordan C BRK 1 5.0 -168
Jimmy Butler SG CHI 10 42.2 195
Pau Gasol PF CHI 9 32.6 191
Nazr Mohammed C CHI 2 5.5 155
Mike Dunleavy SF CHI 10 32.1 137
Derrick Rose PG CHI 10 37.6 123
Joakim Noah C CHI 10 31.9 120
Doug McDermott SF CHI 2 3.5 119
Taj Gibson PF CHI 10 23.5 117
Kirk Hinrich SG CHI 8 10.4 89
Nikola Mirotic PF CHI 9 14.7 10
Tony Snell SF CHI 9 14.4 7
E’Twaun Moore SG CHI 2 3.0 -5
Aaron Brooks PG CHI 10 11.5 -14
Kevin Love PF CLE 4 26.8 165
Timofey Mozgov C CLE 8 25.5 152
Kyrie Irving PG CLE 8 40.0 143
Tristan Thompson PF CLE 8 30.6 141
LeBron James SF CLE 8 41.9 120
Iman Shumpert SG CLE 8 31.9 113
J.R. Smith SG CLE 6 26.7 107
Mike Miller SF CLE 2 14.5 84
Shawn Marion SF CLE 3 4.0 48
James Jones SF CLE 8 12.6 28
Matthew Dellavedova SG CLE 8 16.3 20
Kendrick Perkins C CLE 4 5.0 -4
Joe Harris SG CLE 1 2.0 -217
Al-Farouq Aminu SF DAL 5 30.0 177
Tyson Chandler C DAL 5 32.0 161
Charlie Villanueva PF DAL 5 8.6 135
Monta Ellis SG DAL 5 39.4 111
Dirk Nowitzki PF DAL 5 36.2 109
Jose Barea PG DAL 5 30.8 68
Raymond Felton PG DAL 3 12.0 18
Rajon Rondo PG DAL 2 18.5 15
Bernard James C DAL 1 2.0 0
Greg Smith PF DAL 1 1.0 0
Amar’e Stoudemire PF DAL 5 15.0 -3
Devin Harris PG DAL 4 18.5 -14
Richard Jefferson SF DAL 4 12.8 -30
Chandler Parsons SF DAL 1 37.0 -33
Dwight Powell PF DAL 2 1.5 -81
Stephen Curry PG GSW 7 39.6 179
Andrew Bogut C GSW 7 25.9 159
Harrison Barnes SF GSW 7 32.3 151
Draymond Green SF GSW 7 38.7 149
Klay Thompson SG GSW 7 37.1 130
Festus Ezeli C GSW 7 6.3 55
Andre Iguodala SG GSW 7 28.0 53
Shaun Livingston PG GSW 7 14.4 49
Leandro Barbosa SG GSW 7 12.6 35
Marreese Speights PF GSW 7 7.3 21
Justin Holiday SG GSW 1 1.0 0
David Lee PF GSW 2 4.5 -106
James Michael McAdoo PF GSW 1 1.0 -285
James Harden SG HOU 9 35.7 190
Dwight Howard C HOU 9 32.7 167
Jason Terry SG HOU 9 26.8 95
Clint Capela C HOU 9 7.8 82
Terrence Jones PF HOU 9 24.4 78
Trevor Ariza SF HOU 9 37.4 64
Josh Smith PF HOU 9 22.2 61
Pablo Prigioni PG HOU 9 20.7 34
Corey Brewer SF HOU 9 26.0 15
Nick Johnson SG HOU 5 5.6 -7
Joey Dorsey PF HOU 5 2.4 -36
Kostas Papanikolaou SF HOU 5 3.0 -199
Chris Paul PG LAC 9 36.0 230
DeAndre Jordan C LAC 11 34.3 193
Blake Griffin PF LAC 11 39.4 193
Spencer Hawes PF LAC 5 6.2 102
Austin Rivers PG LAC 11 18.3 90
Matt Barnes SF LAC 11 30.3 90
Dahntay Jones SF LAC 9 1.7 87
J.J. Redick SG LAC 11 38.7 81
Jamal Crawford SG LAC 11 27.5 41
Lester Hudson SG LAC 5 6.8 31
Glen Davis PF LAC 11 11.5 1
Hedo Turkoglu SF LAC 10 5.1 -23
Ekpe Udoh PF LAC 4 3.0 -57
Jordan Adams SG MEM 2 1.0 853
Russ Smith PG MEM 1 1.0 284
Mike Conley PG MEM 5 27.8 192
Marc Gasol C MEM 8 37.1 172
Courtney Lee SG MEM 8 33.5 161
Tony Allen SG MEM 8 32.1 151
Kosta Koufos C MEM 8 11.8 141
Beno Udrih PG MEM 7 19.6 92
Vince Carter SG MEM 8 15.8 73
JaMychal Green PF MEM 2 1.0 69
Zach Randolph PF MEM 8 35.5 66
Nick Calathes SG MEM 6 17.3 18
Jeff Green SF MEM 8 25.6 7
Jon Leuer PF MEM 2 2.0 -37
Zaza Pachulia C MIL 6 21.5 140
Jared Dudley SG MIL 6 18.3 122
John Henson C MIL 6 25.5 118
Khris Middleton PF MIL 6 38.7 88
Jerryd Bayless PG MIL 6 20.0 53
Tyler Ennis PG MIL 1 16.0 47
Giannis Antetokounmpo SG MIL 6 33.5 47
Michael Carter-Williams PG MIL 6 31.8 43
O.J. Mayo SG MIL 6 26.0 41
Jorge Gutierrez PG MIL 1 12.0 24
Ersan Ilyasova PF MIL 6 23.7 21
Johnny O’Bryant PF MIL 1 12.0 -3
Miles Plumlee C MIL 1 16.0 -66
Alexis Ajinca C NOP 3 3.3 244
Anthony Davis PF NOP 4 43.0 198
Dante Cunningham PF NOP 4 18.8 143
Quincy Pondexter SF NOP 4 31.0 95
Omer Asik C NOP 4 19.8 91
Eric Gordon SG NOP 4 35.8 85
Ryan Anderson PF NOP 4 23.8 81
Jrue Holiday PG NOP 3 18.3 58
Tyreke Evans SF NOP 4 31.3 49
Norris Cole PG NOP 4 26.5 -39
Allen Crabbe SG POR 2 19.5 150
Meyers Leonard C POR 5 21.2 144
Alonzo Gee SF POR 1 3.0 133
Joel Freeland C POR 2 3.5 96
C.J. McCollum SG POR 5 33.2 93
Robin Lopez C POR 5 23.4 89
LaMarcus Aldridge PF POR 5 41.6 79
Nicolas Batum SF POR 5 41.8 66
Chris Kaman C POR 3 12.3 56
Damian Lillard PG POR 5 40.2 54
Steve Blake PG POR 5 8.6 -26
Arron Afflalo SG POR 3 20.0 -130
Tim Frazier PG POR 2 1.5 -312
Tim Duncan PF SAS 7 35.7 213
Kawhi Leonard SF SAS 7 35.7 154
Patrick Mills PG SAS 7 16.0 154
Marco Belinelli SG SAS 7 16.6 136
Boris Diaw PF SAS 7 28.3 96
Danny Green SG SAS 7 29.1 86
Manu Ginobili SG SAS 7 18.7 80
Cory Joseph PG SAS 4 5.5 77
Jeff Ayres PF SAS 3 4.0 43
Tiago Splitter C SAS 7 17.6 23
Tony Parker PG SAS 7 30.0 -18
Aron Baynes C SAS 4 10.0 -52
Matt Bonner PF SAS 7 5.1 -70
Greg Stiemsma C TOR 1 2.0 530
Jonas Valanciunas C TOR 4 26.5 141
Patrick Patterson PF TOR 4 26.5 121
Amir Johnson PF TOR 4 28.0 90
DeMar DeRozan SG TOR 4 39.8 74
Terrence Ross SF TOR 4 26.8 38
Lou Williams SG TOR 4 25.5 26
Greivis Vasquez PG TOR 4 25.3 14
Kyle Lowry PG TOR 4 32.8 -6
Tyler Hansbrough PF TOR 4 12.0 -13
James Johnson PF TOR 2 6.0 -117
Marcin Gortat C WAS 7 32.6 227
John Wall PG WAS 5 38.2 175
Paul Pierce SF WAS 7 29.4 160
Otto Porter SF WAS 7 33.3 153
Kris Humphries PF WAS 1 5.0 140
Bradley Beal SG WAS 7 41.3 109
Drew Gooden PF WAS 7 18.3 101
Ramon Sessions PG WAS 7 22.6 62
Nene Hilario PF WAS 7 24.6 54
Will Bynum SG WAS 2 8.5 35
Martell Webster SF WAS 1 4.0 34
Kevin Seraphin C WAS 5 8.8 -19
Garrett Temple SG WAS 2 11.0 -46
Rasual Butler SF WAS 2 3.5 -82

The Inside Story of How the Wizards Beat the Raptors

Gortat warrior

The Washington Wizards vanquished the Toronto Raptors in the first round of the NBA playoffs thanks to an innovative approach conceived by team president Ernie Grunfeld, funded by owner Ted Leonsis, and implemented by head coach Randy Wittman. Drawing upon unique abilities possessed by point guard John Wall, Wittman and Grunfeld developed a plan that in the days before the playoffs sent Wall and center Marcin Gortat on a (until now) top secret mission to prehistoric times.

“It was just a little time travel,” Wall said, stifling a yawn. “Just doing whatever I can to help my teammates out.”

” ‘Time travel?’ He said that?” Wittman snapped when told of Wall’s comment. “Okay, first of all, it’s not time travel. It’s just a way of using John’s ability to alter the space-time continuum to bridge the interdimensional gap between this reality and another in which conditions very much like our prehistoric era continue to exist.”

According to sources, Wall was essential to executing the project, but Gortat volunteered.

“We were going to play Raptor,” the Polish center said. “This way I could study real raptor, see how it move, see how it fight, see how it love. I fight six velociraptor at same time — hand-to-hand. After that, Toronto Raptor not so tough.”

While Gortat engaged in mortal battle with ferocious dinosaurs from the later Cretaceous Period, Wall did no fighting and did not engage with the ferocious reptiles.

“I’m competitive, but I’m not a fighter,” Wall said. “i just mostly slept.”

While Wall’s account of an extended nap — made necessary, he said, by the rigors of time travel — had its charm, it did not stand up to investigation. In reality, Wall executed the second part of the Grunfeldian Plan, and tracked down a pubescent Paul Pierce.

“Paul’s one of the oldest players in the league, and we were concerned about his physical condition,” said Wizards vice president Tommy Sheppard, speaking on condition of anonymity. “By sending John and March back seventy-one million years, we felt we could get March first-hand experience with some velociraptors and we could do something to help Paul get back to top form. This was definitely a two birds, one stone kind of thing.”

Wall’s mission was to locate the young Pierce and persuade him to provide biological samples, including blood, spinal fluid and stem cells. The samples would then be combined in Wittman’s laboratory, located deep beneath the Verizon Center, into a genetic cocktail that would rejuvenate the aging Pierce.

“Gotta say it didn’t take much convincing,” Wall said when he learned that details of his trip were known. “Once I told him about his later self being on a team in the playoffs, his competitive nature kicked in and he wanted to help. ‘Course I first had to beat him in a game of Micropachycephalosaurus before he’d do it, but basketball hadn’t even been invented back then so I had a little bit of an advantage. It was tough, but…well…you saw what happened in round one. Look man, Pierce ain’t changed a bit.”

Successful execution of the Grunfeldian Plan had several positive effects fans could see. Gortat and Pierce performed spectacularly in round one. And, freed from the rigors of researching and theorizing about interdimensional temporal travel, Wittman was able to refocus his attention on coaching the team.

“I looked at the numbers and said to the guys ‘What the hell is this?’ ” Wittman said. “Why are we taking so many two-point jumpers? What’s wrong with you people? Do I have to think of everything? Attack the hoop and shoot threes.”

The plan nearly backfired, however, when Wall, exhausted from interdimensional travel, searching for the younger version of Pierce, and the epic game of Micropachycephalosaurus, played horribly in game one. Sources with knowledge of the situation said Wall recovered thanks to some remaining bottles of Caron Butler’s “Tuff Juice.”

While details remain scarce, preparation for the team’s second round matchup with the Atlanta Hawks involved a journey to Middle Earth where Gortat taught teammates the art of riding the Great Eagles of Manwë. Sources could not corroborate the story with cell phone photos or video by publication time. I was able to obtain this image of a young Marcin Gortat riding one of the Great Eagles in Middle Earth, which Gortat claims is located not far from where he was born in Lodz, Poland.

A young Marcin Gortat riding a Great Eagle of Manwë.

Player Production Average: First Round

Player Production Average (PPA) is an overall rating stat I developed that credits players for things they do that help a team win and debits them for things that hurt the cause. PPA is pace neutral, accounts for defense, and includes a “degree of difficulty” factor based on the level of competition a player faces while on the floor. In PPA, 100 = average, higher is better and replacement level is 45.

WASHINGTON WIZARDS
POS GMS MPG PPA
Marcin Gortat C 4 31.3 294
Paul Pierce SF 4 28.5 209
Will Bynum SG 1 4.0 183
John Wall PG 4 38.0 165
Otto Porter SF 4 32.0 147
Kris Humphries PF 1 5.0 146
Bradley Beal SG 4 41.8 116
Drew Gooden PF 4 20.5 107
Nene Hilario PF 4 24.3 82
Ramon Sessions PG 4 16.5 67
Kevin Seraphin C 3 11.0 50
Martell Webster SF 1 4.0 36
Rasual Butler SF 2 3.5 -85
TORONTO RAPTORS POS GMS MPG PPA
Greg Stiemsma C 1 2.0 535
Jonas Valanciunas C 4 26.5 142
Patrick Patterson PF 4 26.5 122
Amir Johnson PF 4 28.0 91
DeMar DeRozan SG 4 39.8 75
Terrence Ross SF 4 26.8 38
Lou Williams SG 4 25.5 26
Greivis Vasquez PG 4 25.3 14
Kyle Lowry PG 4 32.8 -6
Tyler Hansbrough PF 4 12.0 -13
James Johnson PF 2 6.0 -118

While the playoffs are the most important part of the NBA season, fans and analysts tend to go overboard in using postseason results to reach new conclusions. The Wizards were impressive in round one, but it’s worth keeping in mind that any given round of the post-season (especially a four-game sweep) is the very definition of Small Sample Size Theater. Bradley Beal led the Wizards with 167 minutes in the first round.

I’d caution against overreaching in using the win over Toronto to make a significant reassessment of the Wizards. They’ll get a tougher test against the Hawks.

That said, the good news from round one was getting good production from the team’s youthful triumvirate. Washington was led by Gortat and Pierce, both of whom were outlandishly efficient, and got outstanding play from Wall and Otto Porter, and solid production from Bradley Beal.

Unsurprisingly (considering Washington’s resounding series win), five Wizards were more productive than the most productive Toronto player. The Raptors were hampered by an extreme lack of production from its backcourt, including a net negative performance from All-Star Kyle Lowry.

Meanwhile, Gortat was the league’s most productive player in the first round, and Pierce’s production ranked eighth.

NBA Playoffs: What Are The Odds?

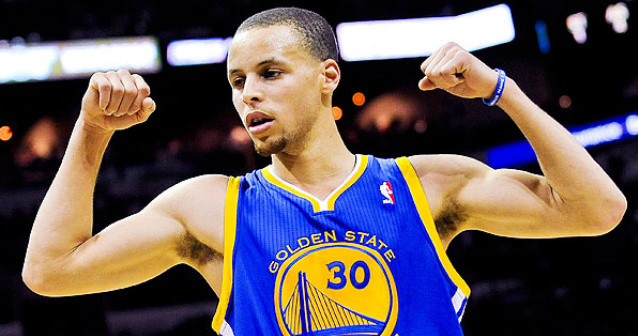
steph curry

Okay, I’ve tried several different ways to talk myself into predicting that the Wizards will somehow beat the Toronto Raptors in the first round of the playoffs and meet their doom in a second round matchup with the Atlanta Hawks. Hasn’t worked, though.

I know Toronto struggled over the last couple months of the season. So did the Wizards. I know the Raptors have a not-so-good coach. So do the Wizards. In a way, the two teams are opposing images of the other. Washington has a good defense and a crummy offense; Toronto has a terrific offense and a bad defense. The key difference: Toronto is better.

The gap between the teams isn’t oceanic. Washington’s odds in any one particular contest in the upcoming series aren’t awful. They have basically a 41% chance of winning at Toronto and a slightly better than coin flip odds of winning at home. In terms of probability, it would be something like winning three straight coin flips, and then winning a “loaded” toss where the odds have been lowered from 50-50 to 60-40. It’s possible, but not likely.

The Wizards could be helped a bit by Kyle Lowry’s iffy back, but the numbers accumulated over a six-month season say they’ll be lucky to pull off the upset. On the bright side for fans hoping to at least be entertained, there’s only about a 9% chance the Raptors sweep.

As you can see from the table below, the Wizards are significant underdogs against the Raptors. The only teams with worse odds of winning their first round series are the eight seeds (Brooklyn and New Orleans), and the East’s seven seed (Boston). The best chances for first-round upsets come in the more balanced West. Houston vs. Dallas and the Clippers vs. the Spurs look to tight.

The best chance for a seeding upset is likely to happen in the second round where the Clippers would be favored against either Houston or Dallas.

The numbers suggest that Golden State — the league’s best team all season — has the best chance of winning the championship this season. I actually estimate them with a better than 50% chance of being champions. Despite coasting through the last few weeks of the season, Atlanta finished the regular season as the East’s best team by a significant margin. They’ll be tested in the Eastern Conference Finals against Cleveland and Lebron James.

EAST
1st RND HOME ROAD WINNER ODDS
1 vs 8 ATL BRK ATL 91%
2 vs 7 CLE BOS CLE 79%
3 vs 6 CHI MIL CHI 70%
4 vs 5 TOR WAS TOR 70%
2nd RND HOME ROAD WINNER ODDS
1 vs 4 ATL TOR ATL 69%
2 vs 3 CLE CHI CLE 64%
ECF HOME ROAD WINNER ODDS
1 vs 2 ATL CLE ATL 61%
WEST
1st RND HOME ROAD WINNER ODDS
1 vs 8 GSW NOP GSW 92%
2 vs 7 HOU DAL HOU 58%
3 vs 6 LAC SAS LAC 57%
4 vs 5 POR MEM POR 61%
2nd RND HOME ROAD WINNER ODDS
1 vs 4 GSW POR GSW 83%
2 vs 3 HOU LAC LAC 65%
WCF HOME ROAD WINNER ODDS
1 vs 3 GSW LAC GSW 73%
FINALS HOME ROAD WINNER ODDS
1 vs 1 GSW ATL GSW 98%

Wizards 2014 Playoffs Wrap-Up

NBA Washington Wizards vs Chicago Bulls Play-Offs Game 4
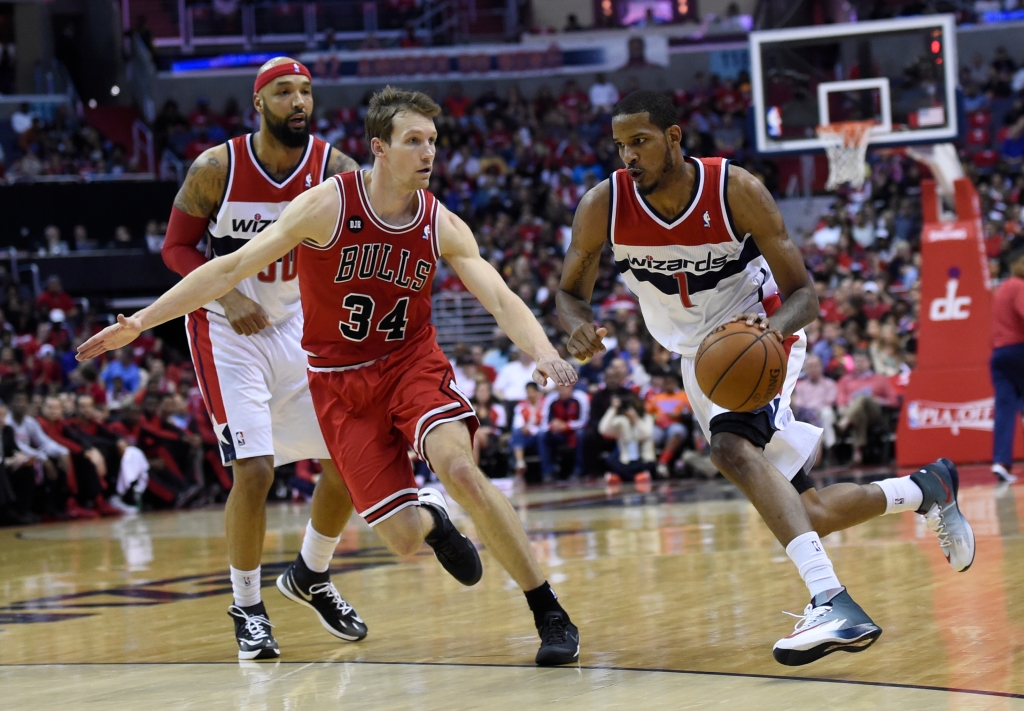
Trevor Ariza dominated in the playoffs despite low-blow karate chop from Mike Dunleavy.

Just in time for the start of training camp, here’s a look back at the Wizards run in the playoffs this year. For those with short memories, Washington beat the Bulls in round one, and lost to the Pacers in round two. It was a good couple weeks for a franchise that’s been among the league’s worst the past several years.

I’ve finally gotten around to crunching the data to produce the Player Production Average (PPA) numbers. PPA is an overall rating metric I developed that credits players for things they do that help a team win, and debits them for things that don’t. It’s a per-minute stat that’s pace-neutral, accounts for defense, and includes a “degree of difficulty” factor based on the level of competition a player faces while on the floor. In PPA, 100 = average, higher is better, and 45 = replacement level.

Like any stat extracted from a small sample size, there’s a grain of salt factor. For example, Bradley Beal led the team with 458 playoff minutes — the cut when I look at regular season numbers is usually 500 minutes. Only 21 players reached 500 or more playoff minutes this year. That said, here are the numbers:

PLAYER GMS MPG RS PPA PS PPA
Trevor Ariza 11 37.0 145 193
Marcin Gortat 11 34.7 154 148
Bradley Beal 11 41.6 96 139
John Wall 11 38.2 139 82
Trevor Booker 9 16.2 123 75
Nene Hilario 10 32.5 102 49
Drew Gooden 10 14.6 106 37
Martell Webster 11 17.7 77 35
Andre Miller 11 9.8 86 12
Al Harrington 7 8.4 24 -22
Garrett Temple 10 .9 24 -33
Otto Porter 3 2.0 15 -49
Kevin Seraphin 4 1.5 35 -274

RS PPA = regular season

PS PPA = post-season

The numbers reflect Ariza’s tremendous playoffs performance. A 193 in the regular season would be worthy of All-NBA selection in most years. Among playoff performers with at least 100 total minutes, it ranked third overall behind Lebron James (263) and Chris Paul (211).

Gortat’s production improved as the playoffs went on. His first round PPA was a shade below average, but his play against Indy in round two pulled his full playoffs rating into the vicinity of his regular season performance.

The team’s only other above-average playoffs producer was Beal, who was terrific in round one (152) and solid in round two. A promising post-season debut for a talented kid who will still be among the league’s youngest players when he starts his third season in a few weeks.

The post-season wasn’t so kind to Beal’s backcourt partner, John Wall. In the first round, Wall’s overall production wasn’t overwhelming, but he thoroughly outplayed Chicago’s guards. Indiana did a better job of forcing him out of comfortable plays, and Wall struggled.

Now-departed Trevor Booker was solid in the first round, but played little in the second round. Friend of the blog Ben Becker wondered if Washington might have won against the Pacers if they’d played Booker instead of Gooden and/or Harrington. And, that’s definitely possible. The games were close and hard-fought, and the Wizards got next to nothing from Gooden and less than nothing from Harrington. Booker was fifth on the team in per minute production during the post-season, but 10th in round two minutes.

Against the Pacers, the Wizards got good production from Gortat, and little else from the front-court. Using the trio of Nenê, Gooden and Harrington with so little court time for Booker may well have cost Washington a trip to the Eastern Conference Finals.

Similarity scores coming soon.

That Path to the Eastern Conference Finals

partingredsea08

In my last post, I alluded to a kind of parting of the seas for the Wizards in the Eastern Conference playoffs. The reasoning is pretty simple: the Wizards should be considered strong favorites over either the Pacers or the Hawks. That’s right, either.

If this was a “normal” NBA season, Washington would be a heavy underdog to the top seeded Pacers. But, if this was a “normal” season, the Wizards wouldn’t have been the fifth seed with 44 wins, Atlanta wouldn’t have been in the playoffs with a sub-.500 record, and Indiana wouldn’t have disintegrated over the last two months of the season (and wouldn’t have had to fight and claw to get to a seventh game against such a pedestrian opponent).

This is an abnormal season, though, and the weak Eastern Conference coupled with the stumble-bum Pacers at the top have given the Wizards their best chance of reaching the NBA’s final four since…1979.

That the Wizards would be favored vs. Atlanta is unsurprising. The Hawks weren’t much good during the regular season. They struggled after center Al Horford tore a pectoral muscle (again), and limped into the playoffs. The Pacers need a bit more explanation — which I provided nearly a month ago when I wondered whether Washington should tank for seventh so they could face Indiana in the first round.

If you want more detail, please click and read on that link. The upshot is this: since the All-Star break, the Pacers have been a very different team. They’ve actually had a negative scoring differential, which is something I don’t think I’ve ever seen for an extended stretch from a highly seeded team. Indeed, since the All-Star break, the Pacers have had the scoring differential of a 34-win team (over an 82-game schedule), just one game better than the eighth seed Hawks. Over that same time frame, Washington’s differential was that of a 52-win team.

Don’t go getting too excited about that differential: the Wizards played an incredibly easy schedule after the All-Star break. Still, it’s illustrative of the significant changes in the Eastern Conference. Since that All-Star break, the Wizards had the third best efficiency differential of the East’s playoff teams. The Pacers had the second worst.

So, what are the odds? Applying a combination of full season numbers, post All-Star break numbers, and playoff performance, I estimate Washington having the following chances of beating these possible Eastern Conference playoff opponents:

  1. Indiana — 64%
  2. Miami — 27%
  3. Toronto — 50%
  4. Chicago — 100%
  5. Washington — 0%
  6. Brooklyn — 67%
  7. Charlotte — eliminated
  8. Atlanta — 81%

The odds will fluctuate a bit after that seventh game, but the fundamental point remains: Washington is in a terrific position to reach the Eastern Conference Finals. Getting farther is a dicier proposition, especially if they end up facing Miami.

Round One Wrap-Up

The 4-1 first round win over the Chicago Bulls is done, but there are still a few points worth making. While there’s been some chatter about how flawed the Bulls are (including by me), Chicago actually looked pretty strong entering the post-season. It’s trademark defense was excellent down the stretch, and its offense was about average. The Eastern Conference team with the best efficiency differential after the All-Star break? The Bulls.

Washington’s first round victory wasn’t a case of getting a crappy opponent, it was a case of the Wizards outplaying a decent team. Give credit where it’s due: a big reason the Bulls looked so bad is that the Wizards were on their game.

Finally, here’s a look at the Player Production Averages (PPA) for the series. PPA is an overall rating metric I developed that credits players for things they do that help a team win, and debits them for things that don’t. It’s a per-minute stat that’s pace-neutral, accounts for defense, and includes a “degree of difficulty” factor based on the level of competition a player faces while on the floor. In PPA, 100 = average, higher is better, and 45 = replacement level. (Don’t pay much attention to the extreme scores at the bottom of the table — tiny sample sizes don’t mean much of anything.)

TEAM Player GMS MPG PPA
CHI Taj Gibson 5 30.8 210
WAS Trevor Ariza 5 39.0 193
WAS Bradley Beal 5 41.0 152
CHI Mike Dunleavy 5 32.6 139
WAS Trevor Booker 5 24.2 134
WAS John Wall 5 38.6 128
WAS Martell Webster 5 18.0 113
WAS Nene Hilario 4 35.8 107
CHI Joakim Noah 5 42.0 97
WAS Marcin Gortat 5 36.0 97
CHI Jimmy Butler 5 43.6 88
CHI Carlos Boozer 5 24.2 58
CHI Kirk Hinrich 5 33.4 22
WAS Andre Miller 5 10.4 10
CHI D.J. Augustin 5 28.2 5
WAS Kevin Seraphin 1 1.0 0
WAS Drew Gooden 4 9.0 -35
CHI Tony Snell 5 9.2 -47
CHI Nazr Mohammed 2 2.5 -189
WAS Al Harrington 3 2.3 -364
WAS Garrett Temple 4 0.3 -1889

Interesting that the most productive player in the series was Taj Gibson, who played just 30.8 minutes per game. Meanwhile, Chicago started Carlos Boozer and played him 24.2 minutes per game despite production that wasn’t much better than replacement level.

Also interesting to me is how the production numbers differ from popular perception. One “experts” poll named Nenê as Washington’s first round “MVP.” When it comes down to doing the things that cause teams to win, he rated sixth best for the Wizards — behind Ariza, Beal, Booker, Wall and Webster.

In total, eight players rated “above average” in this series. Six of those players wore Wizards uniforms. While Gibson was good throughout the series, the only other Bull above average was Dunleavy, and most of his production came in a single game.

Path Opening for Wizards to Make Deep Playoff Run

Ariza dominating

As enjoyable as the Wizards-Bulls series has been so far (for Wizards fans, at least), there’s a tangible feeling that Washington has drawn to an inside straight. (That’s a fancy poker way of saying they’ve gotten lucky.) Yes, I’m aware the Wizards have looked good in the playoffs — teams look good when they win.

I’m also aware that the “experts” at ESPN and TNT (and elsewhere) have declared this Washington as a near-perfect squad with “no weaknesses.” But, much (most?) of the commentary has been a veritable catalog of cognitive biases. Over the course of six months and 82 games, the Wizards were average. A perfectly average team playing against their schedule would be expected to win 43-44 games. They won 44. That’s not a team without weakness — it’s an average team.

In the playoffs, they’re beating the Bulls — a slightly better than average team overall this season, but also a team with a major flaw: one of the league’s worst offenses.

Meanwhile, the Indiana Pacers have continued their post-All-Star break swoon and are struggling to keep pace with the sub.500 Atlanta Hawks. The Wizards should be favored against either team in a second round matchup. Which would put Washington into the conference finals against (probably) the Miami Heat.

It’s the 2013-14 NBA Eastern Conference, where being meh is good enough because nearly everyone else is meh-er.

In many ways, the Wizards this season are a fascinating experiment in perception. On one hand, there’s a solidly average regular season and no top-end production. On the other hand, there’s a likely first-round win against the Bulls and a good chance they make a run to the Eastern Conference Finals.

Folks in the “they’re really not that good” camp can point to the historically weak conference and Indiana’s meltdown, which carved out the path. But…it’s not Washington’s fault their opponents suck. The only thing they can do is play their game and beat whoever’s put in front of them. Being average when others are bad might be a functional equivalent of being good.

For me, it’s clear that the Wizards are an average team that’s drawn a flawed opponent in the first round and has a very good chance of getting a flawed opponent in the second round as well. That said, being average this season and next is probably good enough to hang around in the playoffs for the next year or two before Washington’s older players decline and other teams rebuild sufficiently. Washington won’t be a realistic title contender (even if they make the Eastern Conference Finals), but it’ll be fun to see them playing in May.

In other words, have fun, but don’t go overboard revising conclusions drawn from six months and 82 games worth of data over a few weeks against a couple opponents. What would be cause for some revision? Beating the Heat and making it to the Finals.

At any rate, here are a couple looks at the Wizards-Bulls first round series through the first four games. First up, here’s Player Production Average. PPA is an overall evaluation stat I developed. It’s designed to credit players for things they do that help a team win and “debit” them for things that don’t — each in proper proportion. It’s a pace-adjusted, per minute stat that accounts for defense and includes a degree of difficulty factor based on the level of competition a player faces while on the floor. In PPA, 100 = average, higher is better and 45 = replacement level.)

Player TEAM G MPG PPA
Taj Gibson CHI 4 32.3 215
Trevor Ariza WAS 4 39.5 212
Mike Dunleavy CHI 4 32.3 168
Bradley Beal WAS 4 40.8 161
Martell Webster WAS 4 18.5 135
John Wall WAS 4 38.5 121
Trevor Booker WAS 4 24.5 99
Marcin Gortat WAS 4 36.8 86
Joakim Noah CHI 4 41.8 85
Carlos Boozer CHI 4 23.3 76
Nene Hilario WAS 3 34.7 74
Jimmy Butler CHI 4 43.8 70
Andre Miller WAS 4 10.8 63
D.J. Augustin CHI 4 29.5 43
Kirk Hinrich CHI 4 32.0 0
Kevin Seraphin WAS 1 1.0 0
Drew Gooden WAS 4 9.0 -33
Tony Snell CHI 4 10.3 -59
Nazr Mohammed CHI 2 2.5 -180
Al Harrington WAS 3 2.3 -346
Garrett Temple WAS 3 0.3 -1408

The top two producers have been Taj Gibson and Trevor Ariza. Mike Dunleavy’s high rating is largely a product of a single terrific game in a small sample size. Bradley Beal is having a good series. John Wall and Martell Webster have also been solid.

Folks have gotten excited about Nenê’s play, but the big man hasn’t really played all that well outside of game one.

Want to see why Chicago is struggling? Their only above average performers in these four games have been Gibson and Dunleavy. Noah, Boozer and Butler have been subpar. Augustin and Hinrich have been wretched — especially Hinrich who has given the Bulls 32.0 minutes per game of nothing.

Last, here’s a look at estimated wins added (call them eWins) for the series:

Player TEAM G MPG eWINS
Trevor Ariza WAS 4 39.5 0.68
Taj Gibson CHI 4 32.3 0.56
Bradley Beal WAS 4 40.8 0.53
Mike Dunleavy CHI 4 32.3 0.44
John Wall WAS 4 38.5 0.38
Joakim Noah CHI 4 41.8 0.29
Marcin Gortat WAS 4 36.8 0.26
Jimmy Butler CHI 4 43.8 0.25
Martell Webster WAS 4 18.5 0.20
Trevor Booker WAS 4 24.5 0.20
Nene Hilario WAS 3 34.7 0.16
Carlos Boozer CHI 4 23.3 0.14
D.J. Augustin CHI 4 29.5 0.10
Andre Miller WAS 4 10.8 0.05
Kirk Hinrich CHI 4 32.0 0.00
Kevin Seraphin WAS 1 1.0 0.00
Nazr Mohammed CHI 2 2.5 -0.02
Drew Gooden WAS 4 9.0 -0.02
Garrett Temple WAS 3 0.3 -0.03
Tony Snell CHI 4 10.3 -0.05
Al Harrington WAS 3 2.3 -0.05

This eWins approach uses total production to estimate each player’s individual share of team wins. It works reasonably well over the full season. For the series, it has the Wizards with a 2.4 to 1.7 eWins lead, which is reflective of a couple very close games (Washington’s overtime win in game two, and Chicago’s narrow game three victory.)

Should the Wizards Tank for 7th?

Could 7 be a lucky number for the Wizards?

Last week, I estimated the Wizards’ odds of winning a seven-game series against the teams most likely to make the Eastern Conference playoffs. It was a useful exercise in seeing how Washington stacks up against possible opponents, but it used numbers from the full season, which means my approach didn’t necessarily capture team form lately.

And, the performance of the other seven teams in the playoffs has changed markedly in some cases since the All-Star break. The biggest shift has been the Indiana Pacers meltdown. After opening the season with a 40-12 record, Indy has gone just 13-13 after the All-Star break. More worrisome for the Pacers: they’ve had a negative efficiency differential over the past 26 games — despite an easy schedule.

Let me say that another way: since the All-Star break, the Pacers have been outscored by their opponents. The only other Eastern Conference playoff team to do that — the New York Knicks.

The decline has been an across the board failure for Indiana. Both their offense and defense have gotten worse, neither is showing much sign of improvement, and it may create an “upset” opportunity for whoever gets that seventh seed.

Using team stats since the All-Star break, the Pacers have the scoring differential of a 32-win team (over an 82-game schedule). That’s the weakest performance of any Eastern Conference team by eight games. Next closest is New York, which has played like a 40-win team. Over the same stretch, the Wizards have played like a 47-win team.

So, what’s wrong with Indiana? First, there may have been some significant overrating based on last year’s playoffs. In 2012-13, the Pacers were good-but-not-great during the regular season. Then they went on a strong playoff run. Before this season, the guys over at Boxscore Geeks cautioned that many were overreacting to those playoffs, and projected Indy as a sub-.500 team. That prediction wasn’t so great either — even with their crummy post-All-Star break performance, Indy has 53 wins, but the Boxscore Geeks made a critical point — the Pacers were being crowned as championship contenders without top-end talent, without a season’s worth of sustained excellence — without demonstrating they could consistently play at a championship level.

Early in the season, Indy looked like it would be a worthy rival for the Heat, but that’s old news. Why? There are few “big” things that jump out. Their offensive decline has been significant, but it seems to be an accumulation of little things — a slight decline in their shooting and a narrower rebounding margin.

What’s really making them vulnerable has been the drop in their defensive efficiency. The numbers practically leap off the screen. There are four key categories that define who wins basketball games — shooting, ball handling (turnovers), rebounds, and getting to the free throw line. The Pacers have been worse at all four on defense since the All-Star break. The most significant drop has been in the most important category: shooting.

To make this even simpler, since the All-Star break Indiana has shot worse, has allowed their opponent to shoot significantly better, has grabbed fewer defensive rebounds, and has forced fewer turnovers. While none of the changes is major (except defensive efg), the across-the-board declines add up.

Looking at the individual players suggests that there’s plenty of “blame” to go around. Roy Hibbert is probably first in line — his production (as measured by my stat, Player Production Average (PPA) — where 100 = average, higher is better, and replacement level = 45) is a shade below league average. His PPA of 98 is down 32 from last season, and 57 from two seasons ago. But, David West’s PPA is down 25, and George Hill’s is down by 20.

Paul George and Lance Stephenson are both improved from last season (George from a 133 to a 164; Stephenson from a 94 to a 121), BUT both are down significantly from pre-All-Star production levels. Through the first 25-30 games, George was posting an All-NBA level 200+ PPA. Stephenson was in the 150 range, which is roughly All-Star level.

And oh yeah, the team has also been hurt by roster decisions that weakened their bench. Specifically, they let Tyler Hansbrough (PPA: 82) depart, and replaced him by trading for Luis Scola (PPA: 43). Ian Mahinimi continues to be terrible. And, the trade for Evan Turner has been a predictable debacle.

All of this is a fairly long way of saying that the Wizards might be smart to position themselves as the seventh seed in the East. The Pacers could pull things back together and play as they did earlier in the season, but their recent performances don’t indicate that’s likely. If recent performance levels continue into the playoffs, Indiana could be in for a short, embarrassing 2014 postseason — no matter who they face.

Wizards in the Playoffs?! What Are the Odds?

randy_wittman_john_wall

With last night’s 118-92 thumping of the Boston Celtics, the Wizards clinched a playoff spot for the first since 2008. After a hearty “Woo hoo!” and a few moments of basking in the return to the best basketball tournament on the planet, I immediately started wondering — what are the Wizards chances of advancing?

The answer, of course, depends on the opponent. So, I broke out the odds estimator, and ran the numbers for the Eastern Conference teams that would be in the playoffs if the season ended today (April 3, 2014). I’ll update when the season ends.

SEED TEAM ODDS
1 MIA 19%
2 IND 21%
3 TOR 32%
4 CHI 42%
5 BRK 56%
6 WAS
7 CHA 66%
8 NYK 69%

The “odds” column shows what I estimate the likelihood that the Wizards will defeat that opponent in a seven-game series. So, Washington has a 19% chance of beating the Heat, 21% chance of toppling the Pacers, and so on down the list.

Their most likely first round opponent is either Toronto or Chicago. Between the two, the numbers suggest the Bulls are the more favorable match-up — the Wizards have a 42% chance of beating them in the first round, but only a 32% chance against the Raptors.

The Wizards do NOT want to slip to the seventh or eighth seed to face Miami or Indiana where their chances plummet.

What’s most likely to happen? Well, I ran my odds calculator on the remaining schedules for the Wizards, Raptors, Bulls, Nets and Hornets. Here’s a handy table showing their projected record in their remaining games, their projected final records, and their projected seeds:

  REMAINING GAMES FINAL RECORD PROJECTED SEED
  W L W L  
TOR 7 0 50 32 3
BRK 7 1 47 35 4
CHI 3 4 46 36 5
WAS 5 2 44 38 6
CHA 5 2 42 40 7

Chicago has the toughest remaining schedule, but everyone else gets a few games against Eastern Conference bottom feeders. Based on what’s left of the NBA season, it’s tough to see Washington climbing to fourth or fifth. They’d pretty much have to go 7-0 and hope Chicago and/or Brooklyn falter. And, the Wizards will need to close the season strong to avoid getting caught by Charlotte, which would mean a first round series against the Pacers.