Wizards Remain Mediocre and Will Miss Playoffs for Second Straight Season

Oklahoma City Thunder v Memphis Grizzlies - Game Six

Yeah, I know the season is underway. Many teams have three games in the books; the Spurs already have four. This still serves as my Wizards preview, because while I’ve watched their first two contests (both losses), I’ve used nothing from those games in the projection.

The approach this year is similar to the one I used for previous seasons: every player gets run through my statistical doppelganger machine, which spits out similar players from my historical database (similar production at similar age). There’s a process to weed out players with dissimilar career patterns — it makes no sense to compare a guy who stunk four years and suddenly had a terrific season to a guy like John Wall (for example) who’s been consistently quite good.

Once the list of “similars” is assembled, the system looks at the future of those players as a guide to the potential performance of the players being projected for the upcoming season. When the predicted performance (expressed in terms of Player Production Average — PPA for short) for each individual player has been completed, I estimate minutes (using an approach that must be similar to Kevin Pelton’s since the results were so similar). That gets translated into individual wins, which are totaled to team wins. Wins league-wide are capped at the number of wins available in a season (1230).

What’s new this year? Volume. For the first time, I projected the top 10-12 rotation players of every team. In previous seasons, I ran numbers for only the Wizards. This year — in a never-ending quest to make wrong predictions — I looked at everyone.

The Wizards

The Wizards spent two years hording cap space for an offseason in which nearly half the league would have sufficient room under the cap to pursue free agents with a maximum salary offer. The big prize was hometown hero Kevin Durant, who declined to even meet with the team. The team’s braintrust went after Al Horford (who signed in Boston) before managing to get Ian Mahinmi — a guy who is generously called a “backup” coming off a career year who’s about to turn 30.

Their other roster moves were less inspiring: free agent deals for Andrew Nicholson and Jason Smith, and a trade for Trey Burke. They did manage to sign international guard Tomas Satoransky to a reasonable contract.

Here’s a quick look at what my projection system had to say about this year’s roster:

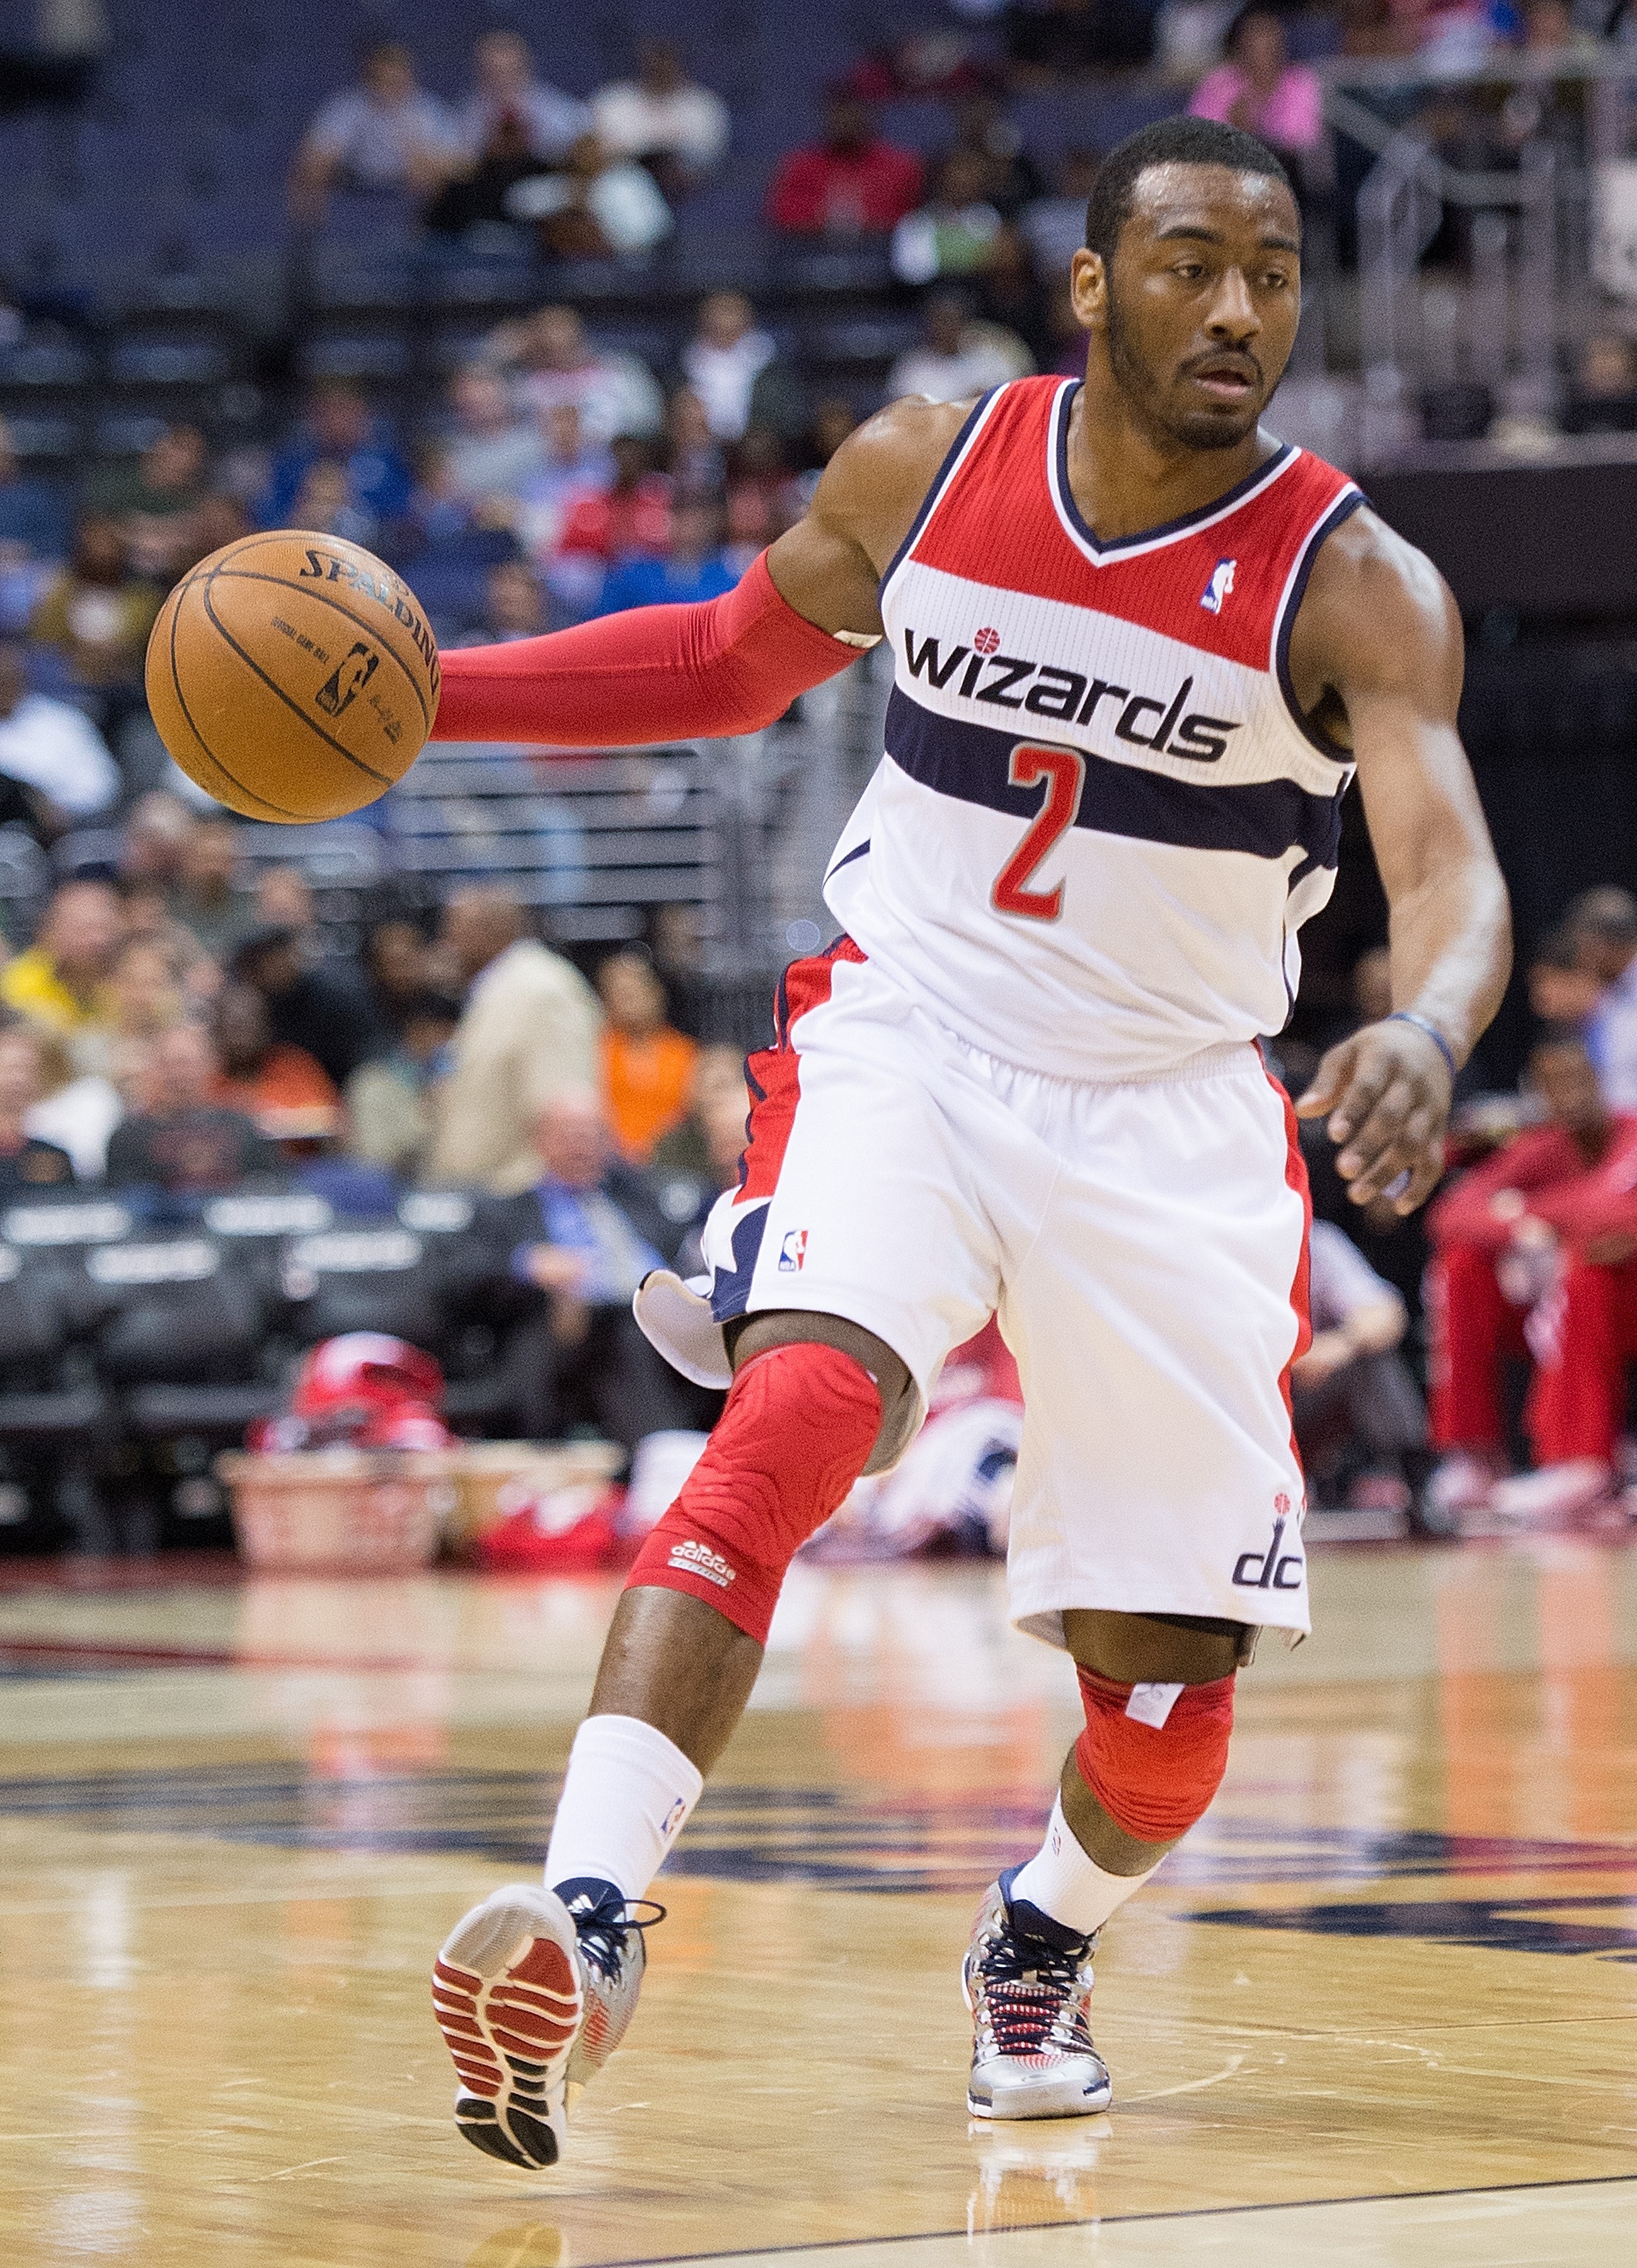
  • John Wall — Good news: Wall’s similars were a collection of very good players (albeit with a penchant for reputations that were better than their production). Bad news: half of the 10 most similar reached their career peak before age 26. More than half saw production declines following their age 25 season. Last season, Wall finished with a PPA of 144. Projected PPA: 130.
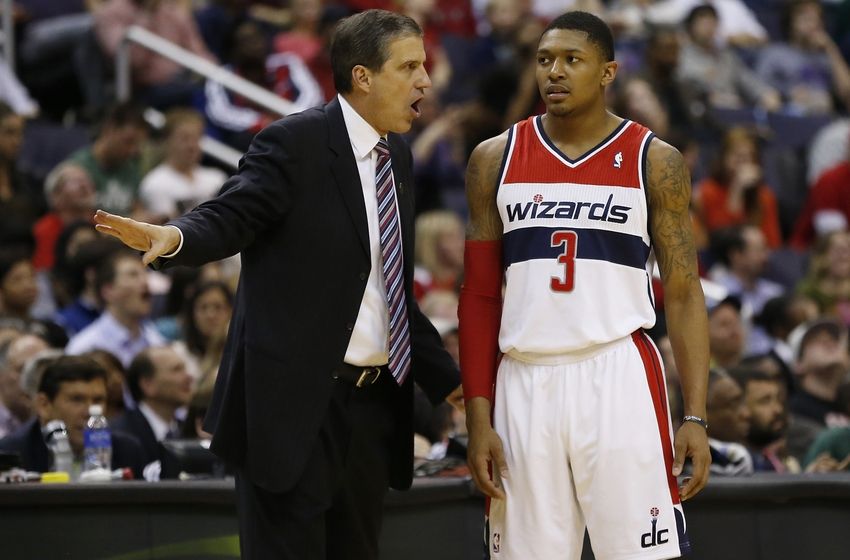
  • Bradley Beal — Beal’s persistent injury troubles overshadow what may be a bigger problem: his consistently mediocre play when he’s been on the floor. His PPA by season (average is 100 and higher is better): 92, 96, 99, 98. Players like Beal tended to peak at “decent starter,” not All-Star or All-NBA. The Wizards awarded him a max contract. Projected PPA: 108.
  • Otto Porter — Porter has improved during his career, and his future looks terrific (projected peak PPA would put him at All-Star level). But, the exercise in projecting the performance of individual players makes clear that it’s unwise to assume a young player will a) improve at all, b) that improvement will be linear, and c) that he’ll ever achieve imagined potential. Similar were useful defensive SF types who were also efficient on offense. But, there was no pattern of improvement after seasons most similar to Porter’s last year. So, Porter projects “about the same” as last year. Projected PPA: 127.
  • Markieff Morris — Last season, Ernie Grunfeld and Ted Leonsis swapped their first round pick in 2016 for Morris, who was deeply unhappy in Phoenix. What they got was a career mediocrity with little chance of getting better. The average peak of players like Morris (in Washington) last season was fairly low (acceptable starter level), and came (on average) at age 25.9. Morris is 27. Projected PPA: 95.
  • Marcin Gortat — The big man has been very good and consistent in Washington. He defied the decline I predicted for last season, and will have to do the same this year. At age 32, a drop in performance is probable — eight of the ten players most similar to Gortat declined the following season, and a ninth maintained. One oldster (Robert Parish) actually improved significantly in his age 35 season. I don’t anticipate something similar in Gortat’s age 32 season. Projected PPA: 147.
  • Trey Burke — The Wizards got him for next to nothing, which was the right price to pay. Burke started his career well below average, and has been less productive each year since. His comps were mostly backups who had short NBA careers. Surprisingly, Eric Maynor didn’t make the list. I’m actually predicting a modest improvement for Burke, although he’s unlikely to be close to what Ramon Sessions provided. Projected PPA: 67.
  • Tomas Satoransky — No comps for Satoransky since he didn’t play in the NBA last season. Although he has experience overseas, the NBA is the world’s most competitive sports league, and most players struggle to make the transition. Projected PPA: 65.
  • Kelly Oubre — The second year swingman seems to have abundant potential despite a horrific rookie season. Unfortunately, the history of players who performed like Oubre isn’t a pleasant one. Improvement was surprisingly modest (I double-checked the spreadsheet cells to make sure they were calculating correctly), and peaks were depressingly low. It’s worth mention that the same was true after Porter’s rookie year, although Porter had an injury. Projected PPA: 37.
  • Andrew Nicholson — The PF is coming off his best season (PPA: 81), which could mean he’s figured things out and is ready to become a useful backup, or…it could be the best he’ll ever play and he’ll recede to previous levels. His comps are useful backup types, and my projection suggests the latter. Projected PPA: 86.
  • Ian Mahinmi — When the Wizards whiffed on their other free agent targets, they turned to Mahinmi. It’s not exactly a bad contract under the league’s new financial realities, but it’s a #SoWizards kinda move. Mahinmi was a career backup who finally got a chance to start and responded with a career year. That’s good, right? Sure, except a) he’s going back to the bench in Washington (the team’s most productive player per possession the past few years (Gortat) plays the same position), and b) he’s about to turn 30. His “most similar” list is mostly journeyman centers. Some had high peaks, but few sustained it. What’s most likely is that he’ll be decent, but not nearly as good as he was last year. Projected PPA: 112.
  • Jason Smith — The decision to give Smith a multi-year deal was puzzling. He has a career PPA of 59, posted a 57 last season, and is 30 years old. It’s another #SoWizards move: no chance of meaningful contributions and no upside. It’s a nice lotto payout for Smith, though. Projected PPA: 50.

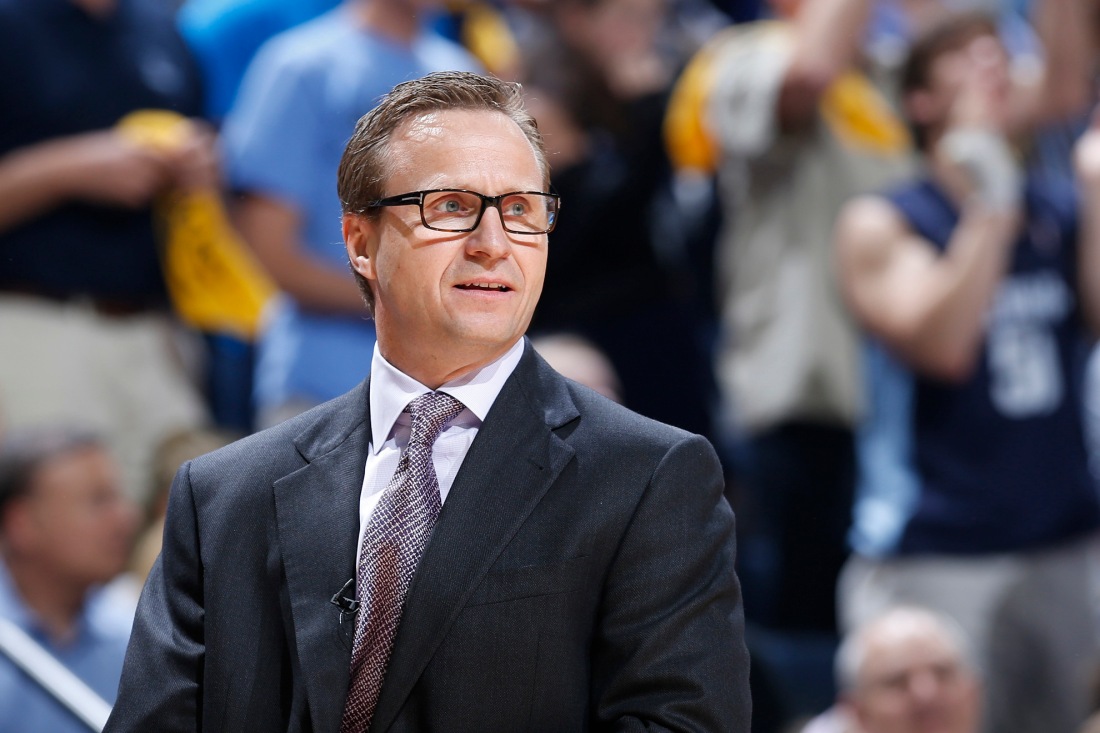
A potential wildcard: new head coach Scott Brooks. Previous coach Randy Wittman had his strengths, but would have ranked in the bottom third in the NBA. Brooks figures to be better, but the relevant research suggests the differences between professional coaches is pretty small. The exceptions are the very best and very worst coaches, but there’s a broad middle ground where coaches help a little or hurt a little, but don’t fundamentally alter their teams’ trajectories. While I think Brooks is an upgrade from Wittman, I also think they both occupy that middle ground.

Options

As I projected the entire league, I found that my process tended to push each team back towards the middle. The gap between the strongest team (Golden State) and the weakest (Phoenix) was about 26.7 wins. In recent years, the difference has been almost double that amount. So, I came up with an alternate method that ranked every team by their projected production, and then applied the average win total for that rank over the past five seasons.

The Wizards project to be ninth team in the East, and 19th in the NBA. Don’t go betting the mortgage, because my approach produced some results that are at odds with my gut and with predictions made by others I respect, such as:

  • My system likes Chicago and thinks the Bulls could finish as a top four team in the East.
  • Orlando projects to make the playoffs (7th seed).
  • Milwaukee and Atlanta both project to be worse than the Wizards.
  • In the West, my system likes Oklahoma City, Minnesota, Utah and Houston more than Portland.

For the Wizards, the win total from my projection system: 41.0. From the average record by league rank approach: 37.5. Take your pick.

My prediction: 41 wins and 9th place in the East.

Those Disappointing Wizards

wittman confused

The surest way to get disappointed is to start with unrealistically high expectations. For exhibit gazillion, I present the 2015-16 Washington Wizards.

During the preseason, there was a fascinating disconnect between fans, media observers, and my statistical analysis. Many, including some of my stat pals at APBRmetrics thought the Wizards would be pretty good. The team seemed to fit a familiar narrative — they’d been bad, they’d gotten a taste of the playoffs (and even won a first round series) in 2013-14, and then had been better yet in 2014-15 (complete with a first round sweep of the Toronto Raptors). Fueled by All-Star John Wall and his young backcourt buddy Bradley Beal, the Wizards would take the next step and become Eastern Conference Contenders.

Over on the message board at RealGM, 76 members predicted the team’s final record. The average prediction: 48.0 wins. (Strictly speaking, 77 members made a prediction. I’m removing my own because it fits into a different category). A helpful soul compiled nine media predictions (strictly speaking, it was eight plus a betting service’s over/under line; also there are ten predictions listed, but 538’s belongs in a different category), which were only slightly less optimistic: 46.6 wins.

Roll all of those up, and it’s 85 predictions ranging from a high of 56 to a low of 37. The group pick: 47.9 wins.

The APBRmetrics crowd was less optimistic — average prediction: 44.8 wins.

My stat-based model predicted 41.4 wins, but I rounded up to 42 in my preseason analysis at Vice. The guys at 538.com predicted 41 wins.

What’s gone wrong? Nothing unexpected, really. Wall’s been maybe a little less productive than anticipated, but he’s quite close to my preseason prediction. Beal hasn’t been as good as I’d predicted — and he got hurt more than I’d expected — but that’s counterbalanced by Marcin Gortat and Otto Porter being healthier and more productive than projected.

So, was it injuries that doomed the Wizards? No. While the Wizards are near the league lead in games missed due to injury, most of the games were missed by bottom of the rotation guys — Alan Anderson, Drew Gooden, Gary Neal. Yes, Nenê and Beal missed their usual allotment. But among players who were on the roster since preseason, they’re fourth and sixth in per possession production. Washington’s three most productive players per possession (Wall, Gortat and Porter) have missed a total of 13 games.

There’s another whopping problem with the “injuries done ’em in” narrative: it’s hopelessly one-sided. For example, when I ran an estimate during the All-Star break on how many additional games the Wizards might have won at full health, I looked only at the Wizards. To do this analysis properly, however, it’s nonsensical to ignore injuries suffered by other teams.

Not having time today for a complete analysis of my own, I turn to ManGamesLost.com. That site lists the Wizards as having the third most games missed due to injury this season. They have two measures of the effect those injuries have had on the team. The Wizards rank 21st in one, and 19th in the other. In other words, injuries have cost Washington LESS in the win column than the average NBA team.

To put it more simply: the injury excuse is bullshit.

So what went wrong? Again, nothing surprising. Most of the players performed to reasonable preseason expectations. The team had been very average in preceding seasons, and several teams in the East improved while the Wizards tried to maintain their averageness.

The reason the Wizards are so disappointing is that fans and media (and apparently the players) set about constructing a narrative of a surging franchise. Unfortunately, the foundation for that narrative consisted of inflated win totals in a historically weak conference, and a massive overestimation of the importance of first round playoff wins.

Keep in mind that the playoffs represent tiny sample sizes. Last season’s postseason lasted 10 games. Washington’s record: 6-4. The previous season, it was 11 games. Their record: 6-5. At any other time in a season, such a performance would be expected for an average team. When it happens in the playoffs, it becomes a portent, an omen. And there’s a dose of that curious one-sidedness when it comes to injuries.

Many said (repeatedly) something to the effect of: “The Wizards might have beat the Hawks if only Wall hadn’t hurt his hand.” Acknowledged far less often is the reality that Washington’s first-round sweep of Toronto was helped by a serious back injury that hobbled Raptors star Kyle Lowry. If we’re going to imagine “what if” scenarios for a full-health Wizards against Atlanta, we also ought to recognize they might not have gotten out of the first round against a full-health Raptors squad.

With five games to go, the Wizards have a slim (about 2%) chance of reaching the postseason. All they need do is win out while Detroit loses three of their remaining four. But, as they limp toward the lottery (with the pick likely going to Phoenix), the team still embodies what I wrote in the preseason: it’s a mediocre roster that lacks an elite producer.

Player Production Average

The ratings below are from a metric I developed called Player Production Average (PPA). In PPA, players are credited for things they do that help a team win, and debited for things that don’t, each in proportion to what causes teams to win and lose. PPA is pace neutral, accounts for defense, and includes an adjustment based on the level of competition faced when a player is on the floor. In PPA, average is 100, higher is better, and replacement level is 45.

League-wide PPA scores through games played 04/05/16 are here.

PLAYER GMS MPG 11/10 11/22 12/3 12/13 12/21 12/30 1/6 1/13 1/27 2/11 3/1 3/14 4/5
Marcin Gortat 71 30.3 91 112 128 133 132 138 147 145 148 151 172 169 171
John Wall 77 36.2 153 129 136 168 157 157 149 144 142 146 153 148 145
Otto Porter 70 30.8 144 158 104 116 107 115 122 127 130 130 134 126 131
J.J. Hickson 11 7.4  –  –  –  –  –  –  –  –  –  – -14 96 108
Markieff Morris 24 26.2  –  –  –  –  –  –  –  –  –  – 41 58 95
Bradley Beal 52 31.3 128 108 96 87 87 86 85 86 98 108 94 94 95
Jared Dudley 76 26.1 36 92 90 85 98 103 100 105 99 104 106 98 89
Nene Hilario 53 19.1 58 90 80 74 79 78 79 88 92 84 86 90 82
Ramon Sessions 77 19.6 131 119 84 90 87 89 88 91 90 89 88 85 76
Alan Anderson 9 14.4  –  –  –  –  –  –  –  –  –  – 97 90 68
Marcus Thornton 11 12.3  –  –  –  –  –  –  –  –  –  –  – -6 65
Garrett Temple 75 24.6 38 106 57 54 70 63 68 79 79 69 59 56 57
Jarell Eddie 22 4.5  –  –  –  –  – 153 119 113 110 86 68 51 55
Kelly Oubre 59 9.8 -103 -4 -40 -44 9 37 43 39 36 29 22 25 27
Drew Gooden 28 10.6 99 51 57 56 56 56 38 47 34 31 26 22 22
DeJuan Blair 29 7.5 -345 -129 -112 -45 -34 -38 -38 -28 -6 -15  –  –  –
Gary Neal 40 20.2 23 49 64 75 78 74 75 78 71 70 69  –  –
Kris Humphries 28 16.6 90 121 95 80 78 76 79 79 78 76  –  –  –
Ryan Hollins 5 9.6  –  – -40 60 59  –  –  –  –  –  –  –  –

Good news: Gortat and Porter continue to play well. Leaving aside the issue of the crummy trade that acquired him, Markieff Morris has been solid after his first four games with the team.

Bad news: Wall remains significantly below the game’s elite performers, Beal continues to rate a bit below average, and key role players (Jared Dudley, Ramon Sessions and Nenê) have all seen production slip over the past few weeks.

In the “puzzling” category goes Randy Wittman’s playing time decisions. The team’s top lineup with more than 100 minutes this season has been Wall-Beal-Porter-Morris-Gortat. Their second best lineup is exactly the same except with Dudley instead of Morris. The second lineup has been together for precisely zero minutes over the past month.

Also puzzling has been the benching of Dudley, who has been a solid player for them throughout the season. Dudley seems ideal as a league average caliber player who gets around 24 minutes per game divided between SF and PF. The Wizards started him at PF much of the season, and have now slashed his minutes from 27.0 minutes per game through the first 72 games to just 14.0 over the last five — 4.5 minutes per game fewer than Garrett Temple.

The Surprising Problem for the Wizards

wall frustrated

One of The Official Narratives of the 2015-16 Washington Wizards season is that point guard John Wall is terrific, but is getting sideswiped by a substandard supporting cast. Last month, The Washington Post’s Dan Steinberg lamented that, “The saddest thing here is that the Wizards might be in the process of sacrificing a year of John Wall’s prime.”

In Michael Lee’s excellent article at Yahoo!, Wall echoed Steinberg, saying: “I ain’t trying to waste a season.

Adam McGinnis and I touched on the subject during our podcast last week.

Alas, as is the case with many Official Narratives, there are problems.

  1. On a per-possession basis, Wall isn’t Washington’s most productive player. That honor goes to center Marcin Gortat. Because Wall plays five more minutes per game than Gortat, Wall leads the team in total production.
  2. Wall is not an elite player.
  3. The overall production difference between Wall (Washington’s top producer) and Gortat (second in total production) has been vastly overstated.
  4. The quality of Wall’s “supporting cast” isn’t bad.

Wall’s PPA (see below) is 148 this year. Among players with at least 500 minutes this season, he ranks 54th. Among point guards, he ranks 11th. Wall has had stretches of dominant play, but his performance continues to be plagued by the same bugaboos he’s had throughout his career: turnovers, poor shot selection and poor shooting. Gortat, by the way, ranks 29th in PPA.

Wall isn’t an elite player. For the past few seasons seasons (including this one, most of the year), he’s rated as a top 8-10 point guard and a top 40-50 player overall. That’s very good, but well short of the impact from elite point guards and elite players. He could be great — he was in December, for example. But his performance game-to-game is a mix of fantastic and horrible. Which averages out to very good, not elite.

The average PPA of top total producers for each team is 179 — 31 points better than Wall. Among those top 30 producers, Wall ranks 24th in per possession production — ahead of Carmelo Anthony, Rajon Rondo, Nerlens Noel, Gordon Hayward, Tyson Chandler and Jordan Clarkson.

The average top producer has provided 22.0% of his team’s production. Wall is about average at 21.8%.

The average gap between a top producer and his team’s “number two” is about 4.5%. For Wall and Gortat, it’s 2.7%. Want a player who actually fits The Official Narrative? Try New Orleans where Anthony Davis has a PPA of 189, provides 26.3% of his team’s production, and (at 13.2%) sports the biggest drop to his team’s second most productive.

Since you’re wondering, the top five in total production shares:

  1. Stephen Curry, GSW — 29.6%
  2. Russell Westbrook, OKC — 26.7%
  3. James Harden, HOU — 26.4%
  4. Lebron James, CLE — 26.3%
  5. Anthony Davis, NOP — 26.3%

And, here’s the top five in drop-off to “number two”:

  1. Anthony Davis, NOP — 13.2%
  2. Stephen Curry, GSW — 12.7%
  3. James Harden, HOU — 8.5%
  4. Kawhi Leonard, SAS — 8.3%
  5. Kyle Lowry, TOR — 8.2%

Wall and the Wizards are 20th.

That’s all fine, you might be saying, but The Official Narrative isn’t necessarily that Wall’s “Robin” sucks, it’s that the roster lacks depth. That lack of depth means Wall has to carry a heavier load than other franchise leaders. Unfortunately, this is also wrong.

For this question, I calculated minutes-weighted PPA (mwPPA) for each team — after deducting the production of its top player. mwPPA provides a handy way of measuring the relative quality of each team’s roster.

The league average “supporting cast” posted an mwPPA of 92. The Wizards rank 14th so far this season with a 93. Since you were wondering, here’s the top five in supporting cast mwPPA:

  1. SAS — 124
  2. GSW — 121
  3. ATL — 107
  4. OKC — 105
  5. BOS — 104

So, to recap:

  • Wall isn’t elite.
  • The gap between Wall’s total production and Gortat’s is smaller than average for a number one to a number two.
  • The Wizards “supporting cast” is mediocre, not terrible.

The real problem for the Wizards is in that first bullet. Their problem: they don’t have an elite player.

Player Production Average

The ratings below are from a metric I developed called Player Production Average (PPA). In PPA, players are credited for things they do that help a team win, and debited for things that don’t, each in proportion to what causes teams to win and lose. PPA is pace neutral, accounts for defense, and includes an adjustment based on the level of competition faced when a player is on the floor. In PPA, average is 100, higher is better, and replacement level is 45.

League-wide PPA scores through games played 3/14/16 are here.

PLAYER GMS MPG 11/10 11/22 12/3 12/13 12/21 12/30 1/6 1/13 1/27 2/11 3/1 3/14
Marcin Gortat 60 30.2 91 112 128 133 132 138 147 145 148 151 172 169
John Wall 66 35.9 153 129 136 168 157 157 149 144 142 146 153 148
Otto Porter 59 30.1 144 158 104 116 107 115 122 127 130 130 134 126
Jared Dudley 65 27.7 36 92 90 85 98 103 100 105 99 104 106 98
J.J. Hickson 6 7.5  –  –  –  –  –  –  –  –  –  – -14 96
Bradley Beal 42 30.6 128 108 96 87 87 86 85 86 98 108 94 94
Nene Hilario 42 18.8 58 90 80 74 79 78 79 88 92 84 86 90
Alan Anderson 8 14.0  –  –  –  –  –  –  –  –  –  – 97 90
Ramon Sessions 66 20.3 131 119 84 90 87 89 88 91 90 89 88 85
Markieff Morris 14 26.0  –  –  –  –  –  –  –  –  –  – 41 58
Garrett Temple 64 25.4 38 106 57 54 70 63 68 79 79 69 59 56
Jarell Eddie 21 4.7  –  –  –  –  – 153 119 113 110 86 68 51
Kelly Oubre 53 10.7 -103 -4 -40 -44 9 37 43 39 36 29 22 25
Drew Gooden 28 10.6 99 51 57 56 56 56 38 47 34 31 26 22
Marcus Thornton 3 15.0  –  –  –  –  –  –  –  –  –  –  – -6
Ryan Hollins 5 9.6  –  – -40 60 59  –  –  –  –  –  –  –
Kris Humphries 28 16.6 90 121 95 80 78 76 79 79 78 76  –  –
Gary Neal 40 20.2 23 49 64 75 78 74 75 78 71 70 69  69
DeJuan Blair 29 7.5 -345 -129 -112 -45 -34 -38 -38 -28 -6 -15  –  –

Randy Wittman vs. Analytics

wittman grimace

Yesterday, Wizards head coach Randy Wittman appeared Sportstalk 980’s “Sports Fix” with Kevin Sheehan and Thom Loverro (as transcribed by the Washington Post’s Dan Steinberg) and provided a treasure trove of comments worth some analysis.

Let’s unpack a bit, shall we?

Writes Steinberg:

The Wizards have their own special history with the [analytics]. There were critics throughout much of the 2014-2015 season who wanted Randy Wittman’s Wizards to play a smaller, faster, more three-point-friendly game, and who sometimes used numbers to make their case. Owner Ted Leonsis, at least in one blog post, seemed sympathetic with their cause.

ESPN the Magazine gave the Wizards a mediocre “analytics” rating, writing that “Washington lags in terms of applying the lessons of analytics to its shot chart even in the midst of the team’s best season since 1978-79.” The Wizards went smaller in the playoffs and found some success. After the season ended, the Wizards held an “analytics” scrimmage, and Leonsis defended the franchise’s use of analytics. And by the start of this season, they were debuting a faster “pace and space” offense that seemed more aligned with modern NBA thinking.

A very fair and cogent summary of the Wizards’ recent history with statistical analysis. The thing that makes me twitch is the notion that “analytics” said the Wizards should play faster. The numbers I track indicated that a) playing fast hadn’t helped the team in recent years, b) that if anything the Wizards were slightly better in slower-paced games, and c) that playing fast or slow or in-between is a bad goal because it doesn’t mean anything. There’s no prize for having a lot of possessions.

During 2014-15 (and the several preceding seasons where stat guys made similar points), the lesson from the numbers was that the Wizards could benefit by exchanging two-point jumpers for threes, at-rim attempts and free throws — to the extent possible. The team’s “go fast” approach was a leap of faith unsupported by the numbers.

From Steinberg:

At least one local critic — ESPN 980 host Kevin Sheehan — has pointed the finger at the “analytics”-inspired change.

“I wouldn’t be surprised if we find out down the road that this small lineup pace-and-space style of play was forced on Randy Wittman and his staff,” Sheehan said recently, “forced on them by some advanced-analytics stats geek who convinced the technological visionary who owns the team that this team was stuck in yesteryear, that this team was stuck in old ways of playing basketball that weren’t going to work anymore:

Hey Ted, Ted, I’ve got this logarithm that I wrote, it’s really cool stuff, I got the idea from an app that I created for sci-fi movies and it’s really gonna work in the NBA, bad twos, you can’t take those anymore, you’ve got to take threes, you’ve got to space and pace, you’ve got to go small, you’ve got to play a stretch 4, this is the way of the future, Ted, this is the way you’ve got to do it. And Ted said to Randy ‘Hey Randy, what do you think about this pace and space and stretch 4s and shoot more threes and it worked in the playoffs and we almost made it to the Eastern Conference finals.

“Jesus!” Sheehan concluded. “This whole thing all season long is just a blown opportunity. A major blown opportunity. I would love to know what Ted is thinking right now.”

If Washington has a stat goober who told them the numbers said they should play fast, he should be fired. Second, the space part of the new offense has probably helped a bit. Last season, the team ranked 22nd in offensive efficiency, 1.9 points per 100 possessions below league average. So far this season, they rank 18th — about 1.0 points per 100 possessions below average.

This is a fairly small effect, which at least one stat goober expected before the season. The Wizards weren’t the only team to apply the lessons of statistical analysis, defenses have been adapting, and games generally come down to overall talent and execution. And the team has middle-of-the-road talent.

Washington’s real problem, of course, has been defense, which has nothing to do with pace or space. Last year, they ranked fifth overall defensively, 2.6 points per 100 possessions better than average. This year: 17th, about a half point per 100 possessions below average. Over the past two seasons (individually or combined), there was no relationship between pace and defensive efficiency.

Appearing on Sheehan and Loverro’s show, Wittman had this to say (courtesy Steinberg):

“I’ve got to coach the team. Analytics haven’t won a ballgame. You’ve got to take what you have and put guys in position that they can best succeed at. And there are some things with numbers that help that, but if you see some of the number sheets that we have, it would drive you crazy. But you know what, that’s the world we live in. You can fight that, but that does you no good. Listen, I’ve been in the business 32 years now. We had analytics back in the ’80s, alright? We had numbers. Plus-minus, and guys playing with certain guys, and that’s never changed. It’s just now, for whatever reason … Hey, it’s good for some people. Because guys have gotten a lot of jobs because of that word.”

A few thoughts. “Analytics” is the study of what wins and loses basketball games. “Analytics” are drawn from the actual games. They’re not made up. When done well, they reveal what’s really happening on the floor, pinpoint what’s important, help coaches and players identify advantages and disadvantages that can be discerned in the numbers, but might escape the naked eye. Analytics are a tool to help coaches and players perform their jobs better, and (hopefully) win more games.

Wittman’s comments suggest the Wizards have some serious internal problems, though — and NOT because he’s resistant to “analytics.” The telling statement is “…if you see some of the number sheets that we have, it would drive you crazy…”

A head coach should not be getting buried with sheets of numbers. He’s a basketball coach, not a statistical analyst. Like many busy people, when presented with an overload of information, he’s going to ignore most of it, seize on a few things he thinks he understands, and then go with what his experience tells him is the right strategy.

The proper role for a statistical analyst is to crunch the numbers, perform the analysis, and then communicate the findings in a way that coaches and decision-makers can understand. If Wittman is being driven crazy by the data, then the analysis department is failing. It sounds like the Wizards may be missing the crucial ability to communicate the findings of their analysts.

Also worth considering is the kind of numbers and information being analyzed and presented. It has become fashionable in recent years to break players into their component skills and seek to construct a roster as if completing a puzzle.

Based on comments made by GM Ernie Grunfeld, the Wizards are big into this kind of analysis. Symptoms include statements such as: the team needs to add “shooting” or “defense” or “rebounding” or “ball handling” or “length” or…you get the idea. As if “shooting” can be “added” to a lineup.

This approach has been borrowed from other sports like football or baseball, where specialists can be extremely valuable. This is much less true in a flowing game like basketball. “Adding” a shooter to the lineup means “subtracting” another player from the floor. Whatever specialty a player is put on the floor to perform, the team gets his whole game — offense and defense. So while it’s worth analyzing what guys are good at doing, it MUST be coupled with analysis of his overall impact on the game.

From Steinberg:

“And not to try to get you into trouble, but it’s been sort of a season-long question for Wizards fans, and I’m a big one,” Sheehan said. “And that is how on board were you with sort of this space-and-pace and pace-and-space and going small?”

“Well, I didn’t have big decisions to make,” Wittman said, “because after the roster was put together with the guys that left and the additions that we had, I had nobody that could back up Marcin [Gortat] at the 5 spot. Kevin Seraphin left and I had nobody there. I thought what was best for our team was to take Nene out of the starting lineup and play him more at 5 than at 4. And that was more just because of the makeup, and we had success with it.”

Good question from Sheehan. Wittman’s answer is…interesting. I agree with his point that the roster construction left him with few lineup choices. I’m baffled by his comment about Seraphin because the big fella was terrible with the Wizards and has been even worse with the Knicks.

From Steinberg:

Wittman said he’s sympathetic with armchair coaches, because he does the same thing when he’s watching baseball or football. But he noted with some amusement that last year critics said his team was playing too big, and this year other critics say his team is playing too small. He said he would run out of minutes if he started a big lineup but then also used Nene as his second-string center, but added that a bigger lineup could be used in a shorter playoff series. And he said this year’s changes have both helped Washington’s offense and hurt its defense.

“There’s no question about it, [it] hurt our rebounding a little bit as well,” he said. “And that’s an important factor for us because we want to run. If you don’t rebound the ball, you can’t run.”

The first part of this struck me as a strawman. Statistical analysis suggested the team would be better off taking fewer two-point jump shots, and that the team could probably benefit by adding a stretch-four. That doesn’t mean “playing smaller” — at least not to me.

I disagree with Wittman that the changes are what hurt the defense. And the rebounding really hasn’t suffered much at all. Last season, the Wizards were third in defensive rebounding at 77.3%. This year, they’ve fallen to tenth, but their defensive rebounding percentage is still a robust 77.0%. More teams than ever are opting to emphasize getting back on defense rather than going for offensive rebounds.

If it’s not rebounding, what’s causing the decline in Washington’s defense? Answer: an inability to make opponents miss. Like last year, the team still does a good job keeping opponents out of the paint (fifth best at preventing opponent at-rim attempts; down from third best last year). However, opponent efficiency on at-rim and three-point attempts has improved. That could be about playing smaller lineups (taller players tend to force lower opponent shooting percentages), but it could be something else such as less effective close-outs on three-point attempts, and/or random variation.

Bottom line: bad analytics didn’t sabotage the Wizards — at least not at the coaching level. What’s hampered them this year is the reality that they have very average talent across the board.

Player Production Average

The ratings below are from a metric I developed called Player Production Average (PPA). In PPA, players are credited for things they do that help a team win, and debited for things that don’t, each in proportion to what causes teams to win and lose. PPA is pace neutral, accounts for defense, and includes an adjustment based on the level of competition faced when a player is on the floor. In PPA, average is 100, higher is better, and replacement level is 45.

League-wide PPA scores through games played 3/1/16 are here.

PLAYER GMS MPG 11/10 11/22 12/3 12/13 12/21 12/30 1/6 1/13 1/27 2/11 3/1
Marcin Gortat 53 31.0 91 112 128 133 132 138 147 145 148 151 172
John Wall 59 35.9 153 129 136 168 157 157 149 144 142 146 153
Otto Porter 52 30.5 144 158 104 116 107 115 122 127 130 130 134
Jared Dudley 58 28.4 36 92 90 85 98 103 100 105 99 104 106
Alan Anderson 3 16.0  –  –  –  –  –  –  –  –  –  – 97
Bradley Beal 38 31.0 128 108 96 87 87 86 85 86 98 108 94
Ramon Sessions 59 20.4 131 119 84 90 87 89 88 91 90 89 88
Nene Hilario 35 18.7 58 90 80 74 79 78 79 88 92 84 86
Gary Neal 40 20.2 23 49 64 75 78 74 75 78 71 70 69
Jarell Eddie 18 5.0  –  –  –  –  – 153 119 113 110 86 68
Garrett Temple 57 25.3 38 106 57 54 70 63 68 79 79 69 59
Markieff Morris 7 24.1  –  –  –  –  –  –  –  –  –  – 41
Drew Gooden 27 10.8 99 51 57 56 56 56 38 47 34 31 26
Kelly Oubre 48 11.2 -103 -4 -40 -44 9 37 43 39 36 29 22
J.J. Hickson 2 5.5  –  –  –  –  –  –  –  –  –  – -14
Kris Humphries 28 16.6 90 121 95 80 78 76 79 79 78 76  –
Ryan Hollins 5 9.6  –  – -40 60 59  –  –  –  –  –  –
DeJuan Blair 29 7.5 -345 -129 -112 -45 -34 -38 -38 -28 -6 -15  –

On a per minute basis, Gortat remains the Wizards’ top producer. Wall leads in total production because he plays more minutes.

Markieff Morris has had a rough start to his career in Washington, but should improve over time.

History Hates This Year’s Wizards

USP NBA: WASHINGTON WIZARDS AT DETROIT PISTONS S BKN USA MI

NBA history has a few things to say about the Wizards, but not much of it is encouraging. Washington could radically improve — there are teams that started similar to the Wizards and got better — but the most likely outcome is a losing record, a trip to the lottery, and the possibility of a coaching change.

Combing through the archives at Basketball-Reference produced 39 teams since 1985-86 that had an efficiency differential through their first 32 games similar to Washington’s -3.2. Records varied from a high of 17 (two teams) to a low of 10 (six teams). The group average 12.9 wins — trailing Washington’s 15, but right in line with their expected wins (based on scoring differential).

Some teams like the Wizards (to the same point in the season) went remarkably different directions. At the low end are the 2012-13 Magic, which started 12-20 and managed just eight wins the rest of the season.

At the other extreme are the 2004-05 Nuggets, which started 14-18, fired head coach Jeff Bzdelik, and then finished out the year on a 32-8 run after hiring George Karl. The Nuggets earned the 7th seed in the playoffs, and lost in the first round.

Just 10 of the 39 teams finished with a record of .500 or better. Only four finished the season with a positive schedule-adjusted scoring differential.

On average, the group finished with 33.8 wins and a schedule-adjusted scoring differential of -2.62. Teams like the Wizards did improve, but only by about 0.8 wins per 82 games. Ten teams made the playoffs, but only one (the 2001-02 Charlotte Hornets) could win a series.

Ten teams fired coaches mid-season, but there was no better/worse trend from the changes. Some teams got better after a coaching change; some got worse. Twelve teams made coaching changes after the season. Six teams fired coaches mid-season, AND made a coaching change after the season.

Teams like the Wizards on average:

  • Record: 33.8-48.2
  • Average schedule-adjusted scoring differential: -2.62
  • .500 or better winning percentage: 26%
  • Average conference finish: 10.3
  • Made playoffs: 26%
  • Won a playoff series: 3%
  • In-season coaching change: 26%
  • Post-season coaching change: 31%

Three teams were 15-17 after their first 32 games with an efficiency differential about the same Washington’s. Only one of those teams made the playoffs (the 1992-93 Atlanta Hawks). The Hawks finished 43-39, got the 7th seed, and lost in the first round. After the season, they replaced Bob Weiss with Lenny Wilkens and won 57 games.

The other 15-17 teams — the 2008-09 New Jersey Nets, and the 1994-95 Dallas Mavericks — finished with 34 and 36 wins respectively. Both missed the playoffs, and neither made a coaching change.

Barring significant improvement from the Wizards, the most likely outcome is 35-38 wins and a scoring differential of around -2.0. While Washington is only 2.5 games out of 8th place in the East, it will probably take 44-45 wins. And they have to pull ahead of four other teams in contention for that spot.

There’s still 50 games remaining in the season, so there’s definitely still time for the Wizards to turn things around and salvage the season. Unfortunately, it’s rare for teams that started a year like them to have a happy ending.

Wizards Update: The Everyone Problem

worried wall

Good thing for the Wizards that the NBA season is long because if it ended today, they’d be out of the playoffs and looking at a 2.8% chance of getting Ben Simmons in the 2016 draft.

Washington is just 7-9 with a scoring differential (weighted for strength of schedule) that ranks 23rd — more than a point per game below 22nd ranked Sacramento. This isn’t what fans (or many analysts) expected after the team escaped the first round of the playoffs each of the past two seasons. Washington was supposed to be an Eastern Conference contender, an echelon below Cleveland, but still a force to be reckoned with.

Not so much.

Leaving aside the issue of whether those expectations were realistic, what’s wrong? Lots. As Dean Oliver wrote, there are four key factors that determine winning and losing in basketball: shooting from the floor (efg), turnovers, rebounding, and free throws. Shooting is the most important of these, and the Wizards are tied for 18th in shooting from the floor. They’re second worst at controlling the ball. They’re 27th in offensive rebounding. They get to the free throw line frequently (sixth best), but overall they rank 28th thus far in offensive efficiency.

The situation isn’t much better on defense. They’re 22nd in defensive efg, average in defensive rebounding, and do a good job of forcing turnovers and keeping opponents off the free throw line. But, making the other team miss is the decisive factor: they rank 20th in defense.

Who’s at fault? Everyone, really.

The front office assembled a roster without a starter-quality power forward. While they made a good trade for Jared Dudley (solid player in exchange for nothing), he’s a small forward they’re asking to masquerade as a stretch four. He can get by in the S4 role off the bench, but his lack of rebounding (low career numbers even for a SF), size and athleticism gets exposed against starters. Kris Humphries is a backup; Drew Gooden a bench-warmer; Nenê is aging and injured.

The team obviously established a goal of preserving cap space for free agents in 2016, but wasted short-term signings on Gary Neal, Alan Anderson and Ryan Hollins.

So, put “front office” at the top of the “at fault” list — even without diving down the rabbit hole of botched draft picks and free agent acquisitions in previous years.

Next up: the coaching staff. This season, the team’s braintrust decided to enter basketball modernity by cutting back on two-point jump shots and taking more threes. This shift should have helped the offense run more efficiently even with the team shooting slightly worse from three-point range, but Randy Wittman and company confounded the issue by coupling changed shot selection with playing faster.

The problem: playing faster has nothing to do with playing better. Smart coaching emphasizes strategies that improve efficiency. Swapping two-point jumpers for threes, at-rim attempts and free throws is smart. Playing faster because it’s fashionable is not. (Especially when analysis of the team the past few years suggests the Wizards may have been better in slower-paced games.)

There’s room on the “blame bus” for the players, and rightfully so — virtually everyone who wears the Wizards uniform is under-performing. The only players with a PPA (see below) higher than last year are Otto Porter and Gary Neal, and Porter’s production has cratered since a promising start.

Despite back-to-back outstanding games (vs. Cleveland and the Lakers), John Wall’s PPA is 15 points lower than last season. Marcin Gortat’s production is down 42 points. Bradley Beal is “about the same” (down three points in PPA), but now in his fourth season still rates just average.

Kris Humphries, Jared Dudley, Ramon Sessions, Nenê, Drew Gooden, and Garrett Temple are all performing worse so far this season. All are showing double-digit drops in PPA.

For crissake, even DeJuan Blair, coming off the worst season of his career, is performing worse.

While they don’t belong on the “blame bus,” the Eastern Conference gets some credit for Washington’s poor start. Last season, a stat goober whose name I can’t remember (please take/give credit where it’s due if you read this and know who I’m talking about) estimated that top five teams in the East gained about three wins in 2014-15 because of the sorry state of the conference. This year, several Eastern teams improved while the Wizards attempted to be about the same.

How can the Wizards get better?

  1. De-emphasize pace. Stop worrying about trying to be like Golden State, and play at a pace that makes sense for the roster currently in place. Change the emphasis to valuing possessions and getting good shots, and look for offensive efficiency to rise.
  2. Get Wall and Gortat back to normal. Both are established veterans with production levels significantly better than what they’ve done thus far. It’s hard to believe they’re going to continue playing this poorly.
  3. Get improvement from Beal and/or Porter. Unfortunately, Beal continues to show improvement. He’s much the same player (in terms of overall impact) as he was in his rookie year. Porter started the season well, but has struggled since as teams developed a scouting report. Now it’s time for Porter to come up with ways to produce anyway.
  4. Make a trade. They don’t have a starter-quality PF on the roster.

The season is still young and the Wizards are probably going to start playing better. But, that’s what the Nationals kept saying, and then they ran out of games and the story of their 2015 season was they just weren’t good enough. For the Wizards, there’s an added concern because they need to be good enough to persuade a prominent free agent to join the young core.

Player Production Average

The ratings below are a metric I developed called Player Production Average (PPA). In PPA, players are credited for things they do that help a team win, and debited for things that don’t, each in proportion to what causes teams to win and lose. PPA is pace neutral, accounts for defense, and includes an adjustment based on the level of competition faced when a player is on the floor. In PPA, average is 100, higher is better, and replacement level is 45.

League-wide PPA scores through games played 12/03/15 are here.

PLAYER GAMES MPG 11/10 11/22 PPA
John Wall 16 33.7 153 129 136
Marcin Gortat 16 28.9 91 112 128
Otto Porter 16 32.1 144 158 104
Bradley Beal 13 35.5 128 108 96
Kris Humphries 16 17.6 90 121 95
Jared Dudley 15 24.7 36 92 90
Ramon Sessions 16 17.8 131 119 84
Nene Hilario 12 17.4 58 90 80
Gary Neal 14 19.6 23 49 64
Drew Gooden 6 12.8 99 51 57
Garrett Temple 14 15.8 38 106 57
Ryan Hollins 1 11.0     -40
Kelly Oubre 11 7.5 -103 -4 -40
DeJuan Blair 6 8.5 -345 -129 -112

Wizards Renovated Offense Needs Time

beal rips

The Washington Wizards have embarked on a major renovation of their offense, and while the results are decidedly mixed through their first six games, the right thing is to stay the course and see if players can grow into new roles.

Last season, the Wizards were 18th in pace and 28th in three-point attempt rate (the percentage of field goal attempts from three-point range). So far in 2015-16, they’re second in pace (a whopping 8.4 possessions per 48 minutes faster) and 12th in three-point attempt rate.

The positives so far: decent shooting and an uptick in trips to the free throw line. The negatives: the league’s worst turnover rate, a drop-off in rebounding effectiveness, and an elevated opponent shooting percentage.

While patience is warranted as the team figures out how to operate in the new system, the emphasis on playing at a fast pace continues to be a concern for me. Why? Because pace of play has nothing to do with what causes teams to win games. Go through the record of games and seasons, and you’ll find good (and bad) teams that played fast, slow and in-between. What makes sense is for a team to play at a pace where it’s comfortable, where the players are under control, and where it can get good shots and maximize efficiency. If that’s fast, then play fast. If it’s slower, then slow down.

At the risk of oversimplifying, basketball is a game where teams take turns with the ball until the clock runs out. The number of possessions are about the same for each team over the course of a game — sometimes there’s a possession or two variance based on end-of-period exchanges. Playing fast doesn’t get a team extra possessions because no matter how quick they shoot the ball, the other team gets it back. What matters is efficiency — generating more points on your possessions than the other guy does on his.

The emphasis on playing fast — at least as it’s been implemented by the Wizards so far — seems misguided to me. Pushing the ball up the floor every possession is a good strategy because it can stress the defense, catch defenders out of position, and give Washington more time to run its half court offense. But if rushing leads to more turnovers, and weakened defensive rebounding, the strategy is missing the point.

What really concerns me about the “play fast” mantra is the question of whether the Wizards truly have a grasp on what’s important for a team to win. There’s a palpable feeling that they’re mimicking Golden State without a true understanding of why that style of play works for the Warriors, and how it fits Washington’s personnel. What wins games in the NBA? Doing these things better than the opponent (in order of importance): shooting from the floor, controlling turnovers, getting to the free throw line, and rebounding. Pace ain’t on the list.

Player Production Average

The ratings below are a metric I developed called Player Production Average (PPA). In PPA, players are credited for things they do that help a team win, and debited for things that don’t, each in proportion to what causes teams to win and lose. PPA is pace neutral, accounts for defense, and includes an adjustment based on the level of competition faced when a player is on the floor. In PPA, average is 100, higher is better, and replacement level is 45.

PLAYER GAMES MPG PPA
John Wall 6 34.8 153
Otto Porter 6 34.0 144
Ramon Sessions 6 17.2 131
Bradley Beal 6 34.7 128
Drew Gooden 4 15.0 99
Marcin Gortat 6 28.0 91
Kris Humphries 6 20.5 90
Nene Hilario 6 18.0 58
Garrett Temple 4 3.5 38
Jared Dudley 5 21.6 36
Gary Neal 6 17.7 23
Kelly Oubre 3 5.3 -103
DeJuan Blair 2 6.0 -345

In many ways, I find these numbers (drawn from a small sample size) encouraging. The team’s most productive players so far are its youthful trio of high draft picks: John Wall, Otto Porter, and Bradley Beal.

It’s hard to believe veterans like Marcin Gortat and Jared Dudley will continue playing this poorly. Look for Nenê’s production to improve some as well.

On the other hand, don’t expect big jumps in productivity from DeJuan Blair (who apparently has forgotten how to play basketball), Gary Neal and Garrett Temple.

Also, much as I hate to write it, I think Porter’s PPA is ripe for a drop-off. It’s not likely he’ll continue to shoot 70% from two-point range or have a 60-plus percent efg.

About the Wizards New Offense

wittmanbeal

As a sorta codicil to my Wizards preview at Vice Sports, here’s some background on why the Wizards new “pace & space” offense may not provide as much of a boost to the record as those of us pushing for it might have hoped. And no, this has nothing to do with the house-building performance in the opener at Orlando.

Last season, the Wizards took lots of what Randy Wittman called “good shots.” Wittman’s “good” shots were what us analysts called “the worst shots in the game.” In other words: two-point jumpers. As chronicled in many places around the Internets, the best shots are at-rim, threes, and free throws.

How much better could Washington’s offense have been last season? As economist (and creator of the Wins Produced metric) David Berri might write, with a bit of math I estimated they could have added as much as 1.5 points per 100 possessions merely by having league average shot selection. That may not sound like much, but it translates to 3-4 wins, assuming their defense was the same. In other words, 49-50 wins instead of 46.

So, why am I projecting 42 wins this year instead of 45 or 46? The issue is RELATIVE advantage. Many teams around the league are going to variations of the pace and space. Many teams want to play faster and change their shot mix to emphasize at-rim and three-point attempts.

Improvement from the Wizards offense may be counter-balanced by efficiency improvements in the offenses of other teams, and by the emergence of better defensive strategies as more teams adopt similar offensive playing styles. While the Wizards may be more efficient, other team are likely to be more efficient too — at least until defenses start figuring things out. At which point games will come down to overall talent, execution and as yet undetermined strategic innovations.

Your mileage may vary, but I don’t have much faith in Randy Wittman and his coaching staff to lead the next innovation. That means we’re back to base talent, and the Wizards are about middle of the pack in that area. At least until they sign Kevin Durant next summer.

Projection: Wizards to Win 42

wall 02My 2015-16 Wizards preview is up at Vice Sports. I won’t steal my own thunder much, except to say that my projection approach says the Wizards will win 41-42 games this season. Not as encouraging as I’d hoped, and I had some mild surprises in the numbers — younger players not being predicted to improve as much as I’d have intuitively expected.

At any rate, please click over and give it a read at Vice.

The Inside Story of How the Wizards Beat the Raptors

Gortat warrior

The Washington Wizards vanquished the Toronto Raptors in the first round of the NBA playoffs thanks to an innovative approach conceived by team president Ernie Grunfeld, funded by owner Ted Leonsis, and implemented by head coach Randy Wittman. Drawing upon unique abilities possessed by point guard John Wall, Wittman and Grunfeld developed a plan that in the days before the playoffs sent Wall and center Marcin Gortat on a (until now) top secret mission to prehistoric times.

“It was just a little time travel,” Wall said, stifling a yawn. “Just doing whatever I can to help my teammates out.”

” ‘Time travel?’ He said that?” Wittman snapped when told of Wall’s comment. “Okay, first of all, it’s not time travel. It’s just a way of using John’s ability to alter the space-time continuum to bridge the interdimensional gap between this reality and another in which conditions very much like our prehistoric era continue to exist.”

According to sources, Wall was essential to executing the project, but Gortat volunteered.

“We were going to play Raptor,” the Polish center said. “This way I could study real raptor, see how it move, see how it fight, see how it love. I fight six velociraptor at same time — hand-to-hand. After that, Toronto Raptor not so tough.”

While Gortat engaged in mortal battle with ferocious dinosaurs from the later Cretaceous Period, Wall did no fighting and did not engage with the ferocious reptiles.

“I’m competitive, but I’m not a fighter,” Wall said. “i just mostly slept.”

While Wall’s account of an extended nap — made necessary, he said, by the rigors of time travel — had its charm, it did not stand up to investigation. In reality, Wall executed the second part of the Grunfeldian Plan, and tracked down a pubescent Paul Pierce.

“Paul’s one of the oldest players in the league, and we were concerned about his physical condition,” said Wizards vice president Tommy Sheppard, speaking on condition of anonymity. “By sending John and March back seventy-one million years, we felt we could get March first-hand experience with some velociraptors and we could do something to help Paul get back to top form. This was definitely a two birds, one stone kind of thing.”

Wall’s mission was to locate the young Pierce and persuade him to provide biological samples, including blood, spinal fluid and stem cells. The samples would then be combined in Wittman’s laboratory, located deep beneath the Verizon Center, into a genetic cocktail that would rejuvenate the aging Pierce.

“Gotta say it didn’t take much convincing,” Wall said when he learned that details of his trip were known. “Once I told him about his later self being on a team in the playoffs, his competitive nature kicked in and he wanted to help. ‘Course I first had to beat him in a game of Micropachycephalosaurus before he’d do it, but basketball hadn’t even been invented back then so I had a little bit of an advantage. It was tough, but…well…you saw what happened in round one. Look man, Pierce ain’t changed a bit.”

Successful execution of the Grunfeldian Plan had several positive effects fans could see. Gortat and Pierce performed spectacularly in round one. And, freed from the rigors of researching and theorizing about interdimensional temporal travel, Wittman was able to refocus his attention on coaching the team.

“I looked at the numbers and said to the guys ‘What the hell is this?’ ” Wittman said. “Why are we taking so many two-point jumpers? What’s wrong with you people? Do I have to think of everything? Attack the hoop and shoot threes.”

The plan nearly backfired, however, when Wall, exhausted from interdimensional travel, searching for the younger version of Pierce, and the epic game of Micropachycephalosaurus, played horribly in game one. Sources with knowledge of the situation said Wall recovered thanks to some remaining bottles of Caron Butler’s “Tuff Juice.”

While details remain scarce, preparation for the team’s second round matchup with the Atlanta Hawks involved a journey to Middle Earth where Gortat taught teammates the art of riding the Great Eagles of Manwë. Sources could not corroborate the story with cell phone photos or video by publication time. I was able to obtain this image of a young Marcin Gortat riding one of the Great Eagles in Middle Earth, which Gortat claims is located not far from where he was born in Lodz, Poland.

A young Marcin Gortat riding a Great Eagle of Manwë.

Player Production Average: First Round

Player Production Average (PPA) is an overall rating stat I developed that credits players for things they do that help a team win and debits them for things that hurt the cause. PPA is pace neutral, accounts for defense, and includes a “degree of difficulty” factor based on the level of competition a player faces while on the floor. In PPA, 100 = average, higher is better and replacement level is 45.

WASHINGTON WIZARDS
POS GMS MPG PPA
Marcin Gortat C 4 31.3 294
Paul Pierce SF 4 28.5 209
Will Bynum SG 1 4.0 183
John Wall PG 4 38.0 165
Otto Porter SF 4 32.0 147
Kris Humphries PF 1 5.0 146
Bradley Beal SG 4 41.8 116
Drew Gooden PF 4 20.5 107
Nene Hilario PF 4 24.3 82
Ramon Sessions PG 4 16.5 67
Kevin Seraphin C 3 11.0 50
Martell Webster SF 1 4.0 36
Rasual Butler SF 2 3.5 -85
TORONTO RAPTORS POS GMS MPG PPA
Greg Stiemsma C 1 2.0 535
Jonas Valanciunas C 4 26.5 142
Patrick Patterson PF 4 26.5 122
Amir Johnson PF 4 28.0 91
DeMar DeRozan SG 4 39.8 75
Terrence Ross SF 4 26.8 38
Lou Williams SG 4 25.5 26
Greivis Vasquez PG 4 25.3 14
Kyle Lowry PG 4 32.8 -6
Tyler Hansbrough PF 4 12.0 -13
James Johnson PF 2 6.0 -118

While the playoffs are the most important part of the NBA season, fans and analysts tend to go overboard in using postseason results to reach new conclusions. The Wizards were impressive in round one, but it’s worth keeping in mind that any given round of the post-season (especially a four-game sweep) is the very definition of Small Sample Size Theater. Bradley Beal led the Wizards with 167 minutes in the first round.

I’d caution against overreaching in using the win over Toronto to make a significant reassessment of the Wizards. They’ll get a tougher test against the Hawks.

That said, the good news from round one was getting good production from the team’s youthful triumvirate. Washington was led by Gortat and Pierce, both of whom were outlandishly efficient, and got outstanding play from Wall and Otto Porter, and solid production from Bradley Beal.

Unsurprisingly (considering Washington’s resounding series win), five Wizards were more productive than the most productive Toronto player. The Raptors were hampered by an extreme lack of production from its backcourt, including a net negative performance from All-Star Kyle Lowry.

Meanwhile, Gortat was the league’s most productive player in the first round, and Pierce’s production ranked eighth.