The Washington Wizards vanquished the Toronto Raptors in the first round of the NBA playoffs thanks to an innovative approach conceived by team president Ernie Grunfeld, funded by owner Ted Leonsis, and implemented by head coach Randy Wittman. Drawing upon unique abilities possessed by point guard John Wall, Wittman and Grunfeld developed a plan that in the days before the playoffs sent Wall and center Marcin Gortat on a (until now) top secret mission to prehistoric times.
“It was just a little time travel,” Wall said, stifling a yawn. “Just doing whatever I can to help my teammates out.”
” ‘Time travel?’ He said that?” Wittman snapped when told of Wall’s comment. “Okay, first of all, it’s not time travel. It’s just a way of using John’s ability to alter the space-time continuum to bridge the interdimensional gap between this reality and another in which conditions very much like our prehistoric era continue to exist.”
According to sources, Wall was essential to executing the project, but Gortat volunteered.
“We were going to play Raptor,” the Polish center said. “This way I could study real raptor, see how it move, see how it fight, see how it love. I fight six velociraptor at same time — hand-to-hand. After that, Toronto Raptor not so tough.”
While Gortat engaged in mortal battle with ferocious dinosaurs from the later Cretaceous Period, Wall did no fighting and did not engage with the ferocious reptiles.
“I’m competitive, but I’m not a fighter,” Wall said. “i just mostly slept.”
While Wall’s account of an extended nap — made necessary, he said, by the rigors of time travel — had its charm, it did not stand up to investigation. In reality, Wall executed the second part of the Grunfeldian Plan, and tracked down a pubescent Paul Pierce.
“Paul’s one of the oldest players in the league, and we were concerned about his physical condition,” said Wizards vice president Tommy Sheppard, speaking on condition of anonymity. “By sending John and March back seventy-one million years, we felt we could get March first-hand experience with some velociraptors and we could do something to help Paul get back to top form. This was definitely a two birds, one stone kind of thing.”
Wall’s mission was to locate the young Pierce and persuade him to provide biological samples, including blood, spinal fluid and stem cells. The samples would then be combined in Wittman’s laboratory, located deep beneath the Verizon Center, into a genetic cocktail that would rejuvenate the aging Pierce.
“Gotta say it didn’t take much convincing,” Wall said when he learned that details of his trip were known. “Once I told him about his later self being on a team in the playoffs, his competitive nature kicked in and he wanted to help. ‘Course I first had to beat him in a game of Micropachycephalosaurus before he’d do it, but basketball hadn’t even been invented back then so I had a little bit of an advantage. It was tough, but…well…you saw what happened in round one. Look man, Pierce ain’t changed a bit.”
Successful execution of the Grunfeldian Plan had several positive effects fans could see. Gortat and Pierce performed spectacularly in round one. And, freed from the rigors of researching and theorizing about interdimensional temporal travel, Wittman was able to refocus his attention on coaching the team.
“I looked at the numbers and said to the guys ‘What the hell is this?’ ” Wittman said. “Why are we taking so many two-point jumpers? What’s wrong with you people? Do I have to think of everything? Attack the hoop and shoot threes.”
The plan nearly backfired, however, when Wall, exhausted from interdimensional travel, searching for the younger version of Pierce, and the epic game of Micropachycephalosaurus, played horribly in game one. Sources with knowledge of the situation said Wall recovered thanks to some remaining bottles of Caron Butler’s “Tuff Juice.”
While details remain scarce, preparation for the team’s second round matchup with the Atlanta Hawks involved a journey to Middle Earth where Gortat taught teammates the art of riding the Great Eagles of Manwë. Sources could not corroborate the story with cell phone photos or video by publication time. I was able to obtain this image of a young Marcin Gortat riding one of the Great Eagles in Middle Earth, which Gortat claims is located not far from where he was born in Lodz, Poland.

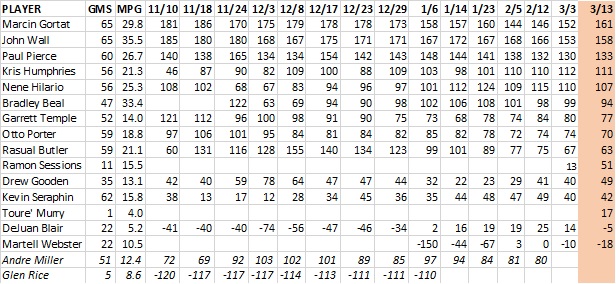
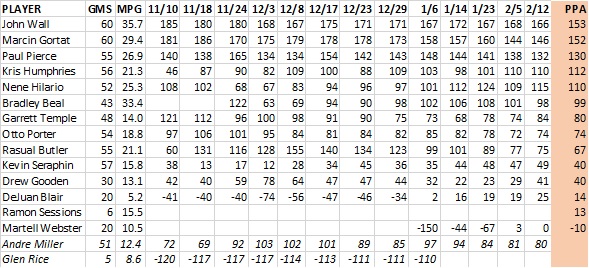
Player Production Average: First Round
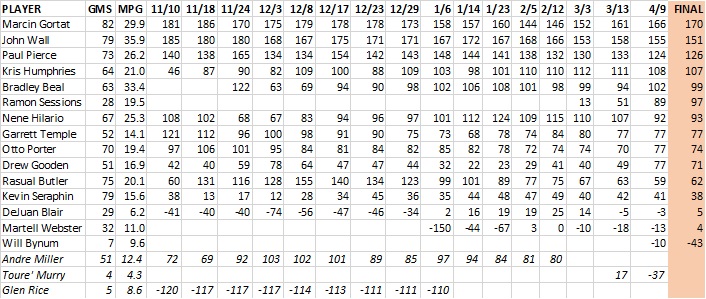
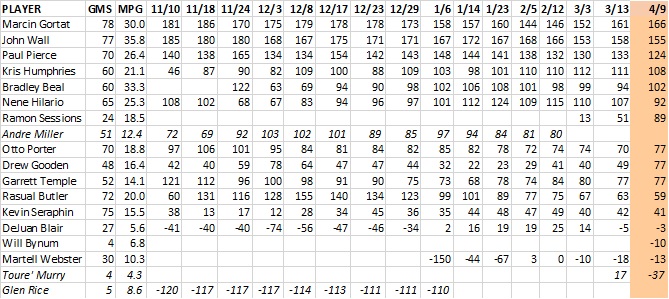
Player Production Average (PPA) is an overall rating stat I developed that credits players for things they do that help a team win and debits them for things that hurt the cause. PPA is pace neutral, accounts for defense, and includes a “degree of difficulty” factor based on the level of competition a player faces while on the floor. In PPA, 100 = average, higher is better and replacement level is 45.
| WASHINGTON WIZARDS |
POS | GMS | MPG | PPA |
| Marcin Gortat | C | 4 | 31.3 | 294 |
| Paul Pierce | SF | 4 | 28.5 | 209 |
| Will Bynum | SG | 1 | 4.0 | 183 |
| John Wall | PG | 4 | 38.0 | 165 |
| Otto Porter | SF | 4 | 32.0 | 147 |
| Kris Humphries | PF | 1 | 5.0 | 146 |
| Bradley Beal | SG | 4 | 41.8 | 116 |
| Drew Gooden | PF | 4 | 20.5 | 107 |
| Nene Hilario | PF | 4 | 24.3 | 82 |
| Ramon Sessions | PG | 4 | 16.5 | 67 |
| Kevin Seraphin | C | 3 | 11.0 | 50 |
| Martell Webster | SF | 1 | 4.0 | 36 |
| Rasual Butler | SF | 2 | 3.5 | -85 |
| TORONTO RAPTORS | POS | GMS | MPG | PPA |
| Greg Stiemsma | C | 1 | 2.0 | 535 |
| Jonas Valanciunas | C | 4 | 26.5 | 142 |
| Patrick Patterson | PF | 4 | 26.5 | 122 |
| Amir Johnson | PF | 4 | 28.0 | 91 |
| DeMar DeRozan | SG | 4 | 39.8 | 75 |
| Terrence Ross | SF | 4 | 26.8 | 38 |
| Lou Williams | SG | 4 | 25.5 | 26 |
| Greivis Vasquez | PG | 4 | 25.3 | 14 |
| Kyle Lowry | PG | 4 | 32.8 | -6 |
| Tyler Hansbrough | PF | 4 | 12.0 | -13 |
| James Johnson | PF | 2 | 6.0 | -118 |
While the playoffs are the most important part of the NBA season, fans and analysts tend to go overboard in using postseason results to reach new conclusions. The Wizards were impressive in round one, but it’s worth keeping in mind that any given round of the post-season (especially a four-game sweep) is the very definition of Small Sample Size Theater. Bradley Beal led the Wizards with 167 minutes in the first round.
I’d caution against overreaching in using the win over Toronto to make a significant reassessment of the Wizards. They’ll get a tougher test against the Hawks.
That said, the good news from round one was getting good production from the team’s youthful triumvirate. Washington was led by Gortat and Pierce, both of whom were outlandishly efficient, and got outstanding play from Wall and Otto Porter, and solid production from Bradley Beal.
Unsurprisingly (considering Washington’s resounding series win), five Wizards were more productive than the most productive Toronto player. The Raptors were hampered by an extreme lack of production from its backcourt, including a net negative performance from All-Star Kyle Lowry.
Meanwhile, Gortat was the league’s most productive player in the first round, and Pierce’s production ranked eighth.