The Wizards fired Randy Wittman for this? Six games into the tenure of Scott Brooks, the team sits 14th in the East with a 1-5 record. Washington’s futility is comprehensive — they rank 23rd in both offensive and defensive efficiency.
There are four key team stats that determine who wins and loses in the NBA. Here’s where the Wizards rank so far on offense:
- Shooting (eFG): 23
- Turnovers (tov%): 26
- Offensive rebounding (oreb%): 12
- Free throw rate (FTM/FGA): 16
On defense:
- Shooting (defensive eFG): 30
- Turnovers (defensive tov%): 9
- Defensive rebounding (dreb%): 12
- Free throw rate (dFTM/dFGA): 14
Don’t get too encouraged by their top ranking in defensive turnovers. Forcing turnovers isn’t necessarily an indicator of defensive effectiveness. In the NBA, defense is overwhelmingly about shot defense. And the Wizards are dead last in that category so far.
Remember the old days when Wizards fans wanted Wittman fired because the team took two-point jumpers instead of threes? Welcome to the new Wizards, same as the old. So far this season, they’re 28th in three-point attempt rate, but have attempted the fourth most two-point jumpers.
On defense, they’re still keeping opponents out of the paint (they have the fourth lowest defensive at-rim attempt rate), but they’re allowing the second highest opponent three-point attempt rate, and the worst opponent 3FG%.
Back to those four key stats for a moment: while there are four, they’re not created equal. Dean Oliver, who first wrote about these factors in a comprehensive manner, determined these approximate historic weights: shooting 40%, turnovers 25%, rebounding 20%, free throws 15%.
In recent years, those values have shifted, according to my analysis. Last season, shooting was worth about 55%, rebounding 18%, turnovers 15%, and free throws 12%.
This is a long and tortured way of saying the Wizards are bad where it matters most. Being worst in shooting differential and 25th in turnover differential overwhelms their decent rebounding and break-even free throw rate.
Player Production Average
Player Production Average (PPA) is an overall rating stat I developed that credits players for things they do that help a team win and debits them for things that hurt the cause. PPA is similar to other linear weight rating metrics such as John Hollinger’s PER, David Berri’s Wins Produced, Kevin Pelton’s VORP, and the granddaddy of them all, Dave Heeren’s TENDEX.
PPA is pace neutral, and weighs a player’s performance per possession against the performance of his competitors season by season. While PPA falls into the category of linear weight metrics, the actual values for each statistical category floats a bit from season to season based on league performance.
PPA is pace neutral, accounts for defense, and includes a “degree of difficulty” factor based on the level of competition a player faces while on the floor. In PPA, 100 is average, higher is better, and replacement level is 45. Read more here.
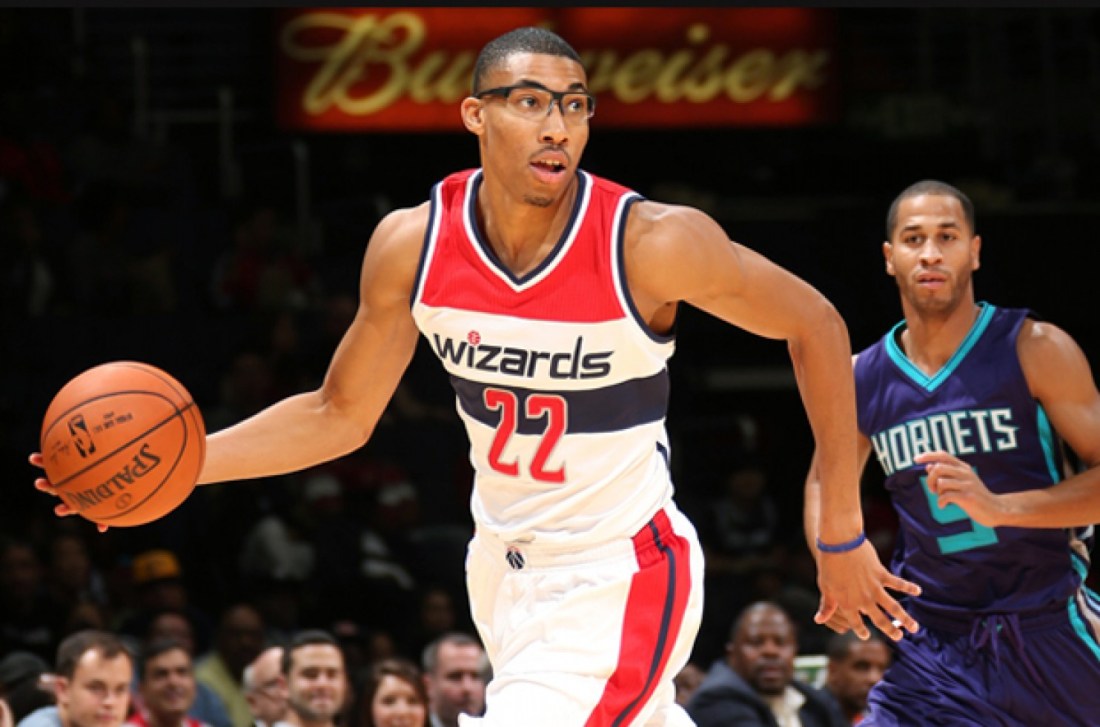
Want some good news, look at Otto Porter, John Wall, and (to a lesser extent) Marcin Gortat. The first two have been highly productive so far. Gortat is the team’s only other above-average performer through six games — although his production has been markedly lower than it was last season.
Wall and Porter offer an interesting contrast. Wall’s high PPA is built on volume — he makes LOTS of plays, both good and bad. He uses more than a third of the team’s possessions when he’s in the game, and he’s racking up rebounds, assists, steals and blocks at a prolific rate. He also sports an astronomical turnover rate (7.8 per 100 team possessions).
Porter is all efficiency. He makes the few shots he attempts. He grabs rebounds at a decent rate, plays solid defense, and avoids turnovers and fouls.
The bad news: everyone else. Markieff Morris and Bradley Beal have been terrible, the bench just about useless.
Ernie Grunfeld’s Plan B offseason acquisitions are off to a rough start. Ian Mahinmi is sidelined with injury, Trey Burke has been the next Eric Maynor (but worse), and Jason Smith has been…well…Jason Smith. Tomas Satoransky needs more time to figure out the NBA game.
The numbers:
| PLAYER |
GMS |
MPG |
PPA |
| Sheldon McClellan |
2 |
3.0 |
478 |
| Otto Porter |
6 |
34.3 |
173 |
| John Wall |
5 |
34.4 |
168 |
| Marcin Gortat |
6 |
36.2 |
135 |
| Markieff Morris |
6 |
34.0 |
67 |
| Bradley Beal |
6 |
34.8 |
66 |
| Andrew Nicholson |
5 |
14.0 |
33 |
| Marcus Thornton |
6 |
17.0 |
31 |
| Tomas Satoransky |
6 |
13.8 |
18 |
| Kelly Oubre |
5 |
15.0 |
18 |
| Trey Burke |
6 |
11.5 |
-48 |
| Jason Smith |
5 |
10.0 |
-93 |
| Daniel Ochefu |
1 |
4.0 |
-181 |