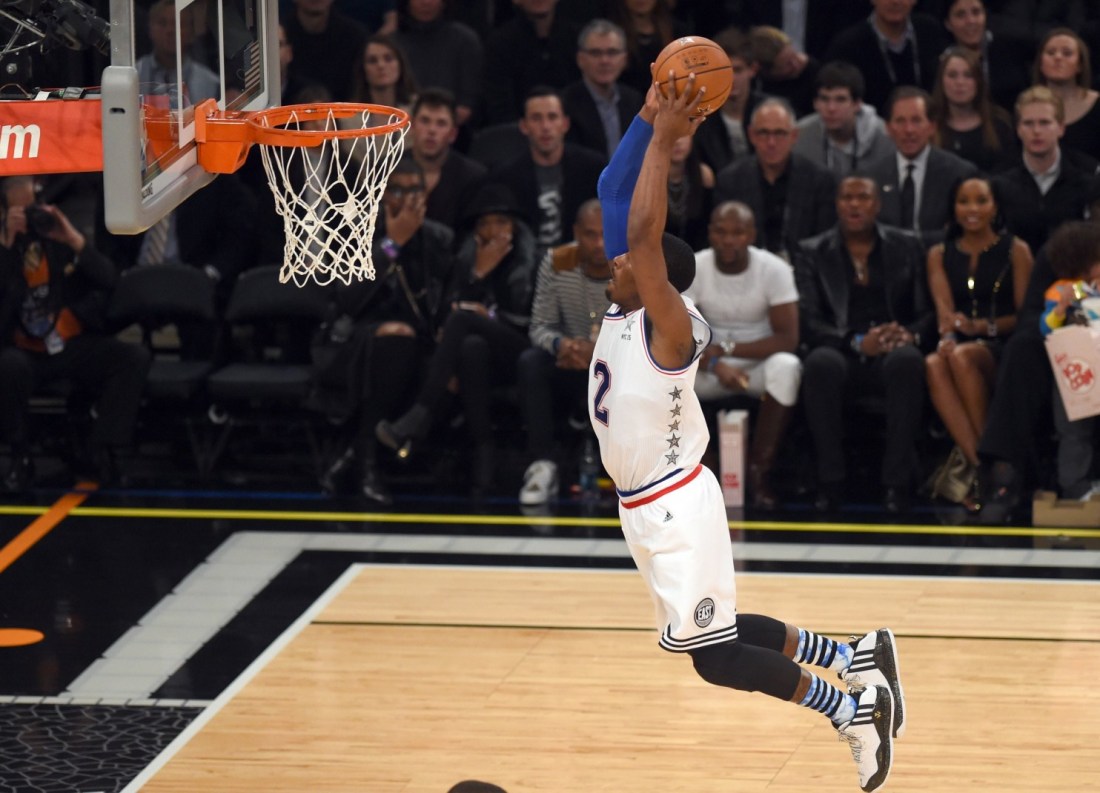
The Wizards are not going to make the playoffs this year. They’re not quite as good as they’ve been the past couple years, which is to say they’re a bit worse than mediocre.
Wizards fans — and perhaps the Wizards themselves — are hanging their dreams of postseason participation on some fragile hooks:
- the schedule gets easier, and
- key Wizards players have returned from injury.
Neither factor holds as much promise for the Wizards as adherents might imagine. The schedule does get easier, but the Wizards are five games below .500 because they’ve played below average basketball through their first 51 games, not because the schedule was difficult.
Before the All-Star break, Washington’s opponents were 0.67 points per game better than average. That’s the approximate quality of a 43-win team over an 82-game schedule. Against this very slightly better than average level of competition, the Wizards got outscored by 2.7 points per game. Which means Washington performed about two points per game worse than average.
The schedule does get easier. Opponents the rest of the way have been a point per game worse than average the rest of the way — about the quality of a 38-win team over an 82-game schedule. In other words, the Wizards are going from playing the approximate quality of an eighth or ninth place team to playing opponents the approximate quality of a ninth or tenth place team.
There are a couple problems, though. First, the Wizards have been worse by a point per game than the aggregate of their remaining opponents. And second, 17 of their remaining games are on the road, and the post All-Star break sprint starts with three games in three nights.
Run the numbers on their remaining schedule, and at this point they’d be the favorite in 11 of their remaining 31 games. If you believe (as I do) the real quality of the team is about average, they’ll probably win between 14 and 17 games the rest of the way – meaning they’d finish with 37 to 40 wins, and would miss the playoffs.
So what about the injuries? The Wizards have indeed lost the NBA’s highest number of player games to injury so far this season. Unfortunately, the players who missed games weren’t the team’s major producers of wins, and their replacements did a reasonable job filling in.
Prior to the All-Star break, I used PPA to quantify how much injuries cost the team. That involved reapportioning minutes (taking playing time from Garrett Temple, Gary Neal and others, and assigning it to players who missed time like Bradley Beal, Nenê, and others). Based on the performance levels of the players involved, I estimate the team would have won two additional games with perfect health.
Two wins is a significant number, but it wouldn’t change the overall trajectory of the season. Washington would be 25-26 – closer to eighth in the East, but still in ninth or tenth place. Even with an easier schedule the rest of the way, the numbers in this “ideal health” scenario would project the Wizards to finish with 41 to 42 wins, and a likely ninth place finish.
Washington still has a theoretical chance to finish eighth. Chicago and Charlotte have suffered injuries — Jimmy Butler’s being far more damaging to the Bulls than Michael Kidd-Gilchrist’s to the Hornets. But, the eighth seed in the East is going to need a minimum of 42 wins, and to do even that well, the Wizards would need to transmogrify from playing like a 37-win team to playing like a 50-win team.
Here’s a simple table showing the task the Wizards have created for themselves. It’s not impossible for them to make the playoffs, but it is highly improbable. The W82 column shows the quality level the Wizards would need to reach the target wins. So, to reach 44 wins this season, they’d need to finish 21-10, which is the approximate level of a 56-win team over an 82-game schedule.
| TARGET | NEED | W82 | ||
| W | L | W | L | |
| 44 | 38 | 21 | 10 | 56 |
| 43 | 39 | 20 | 11 | 53 |
| 42 | 40 | 19 | 12 | 50 |
Player Production Average
The ratings below are from a metric I developed called Player Production Average (PPA). In PPA, players are credited for things they do that help a team win, and debited for things that don’t, each in proportion to what causes teams to win and lose. PPA is pace neutral, accounts for defense, and includes an adjustment based on the level of competition faced when a player is on the floor. In PPA, average is 100, higher is better, and replacement level is 45.
League-wide PPA scores through games played 2/11/16 are here.
| PLAYER | GMS | MPG | 11/10 | 11/22 | 12/3 | 12/13 | 12/21 | 12/30 | 1/6 | 1/13 | 1/27 | 2/11 |
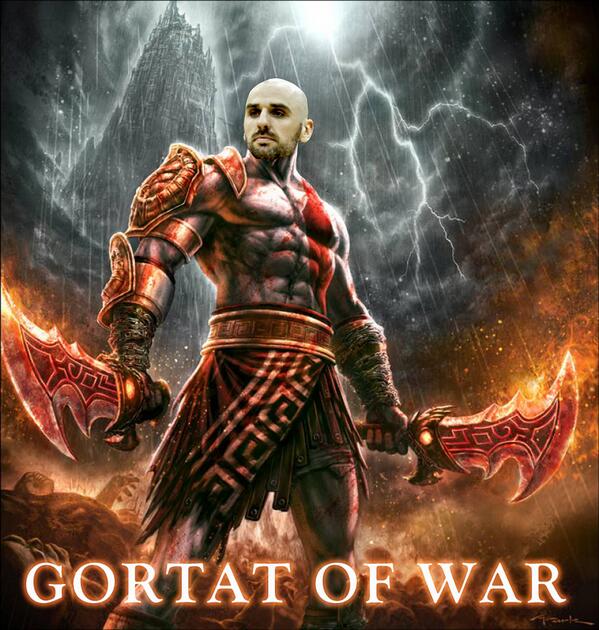
| Marcin Gortat | 45 | 31.2 | 91 | 112 | 128 | 133 | 132 | 138 | 147 | 145 | 148 | 151 |
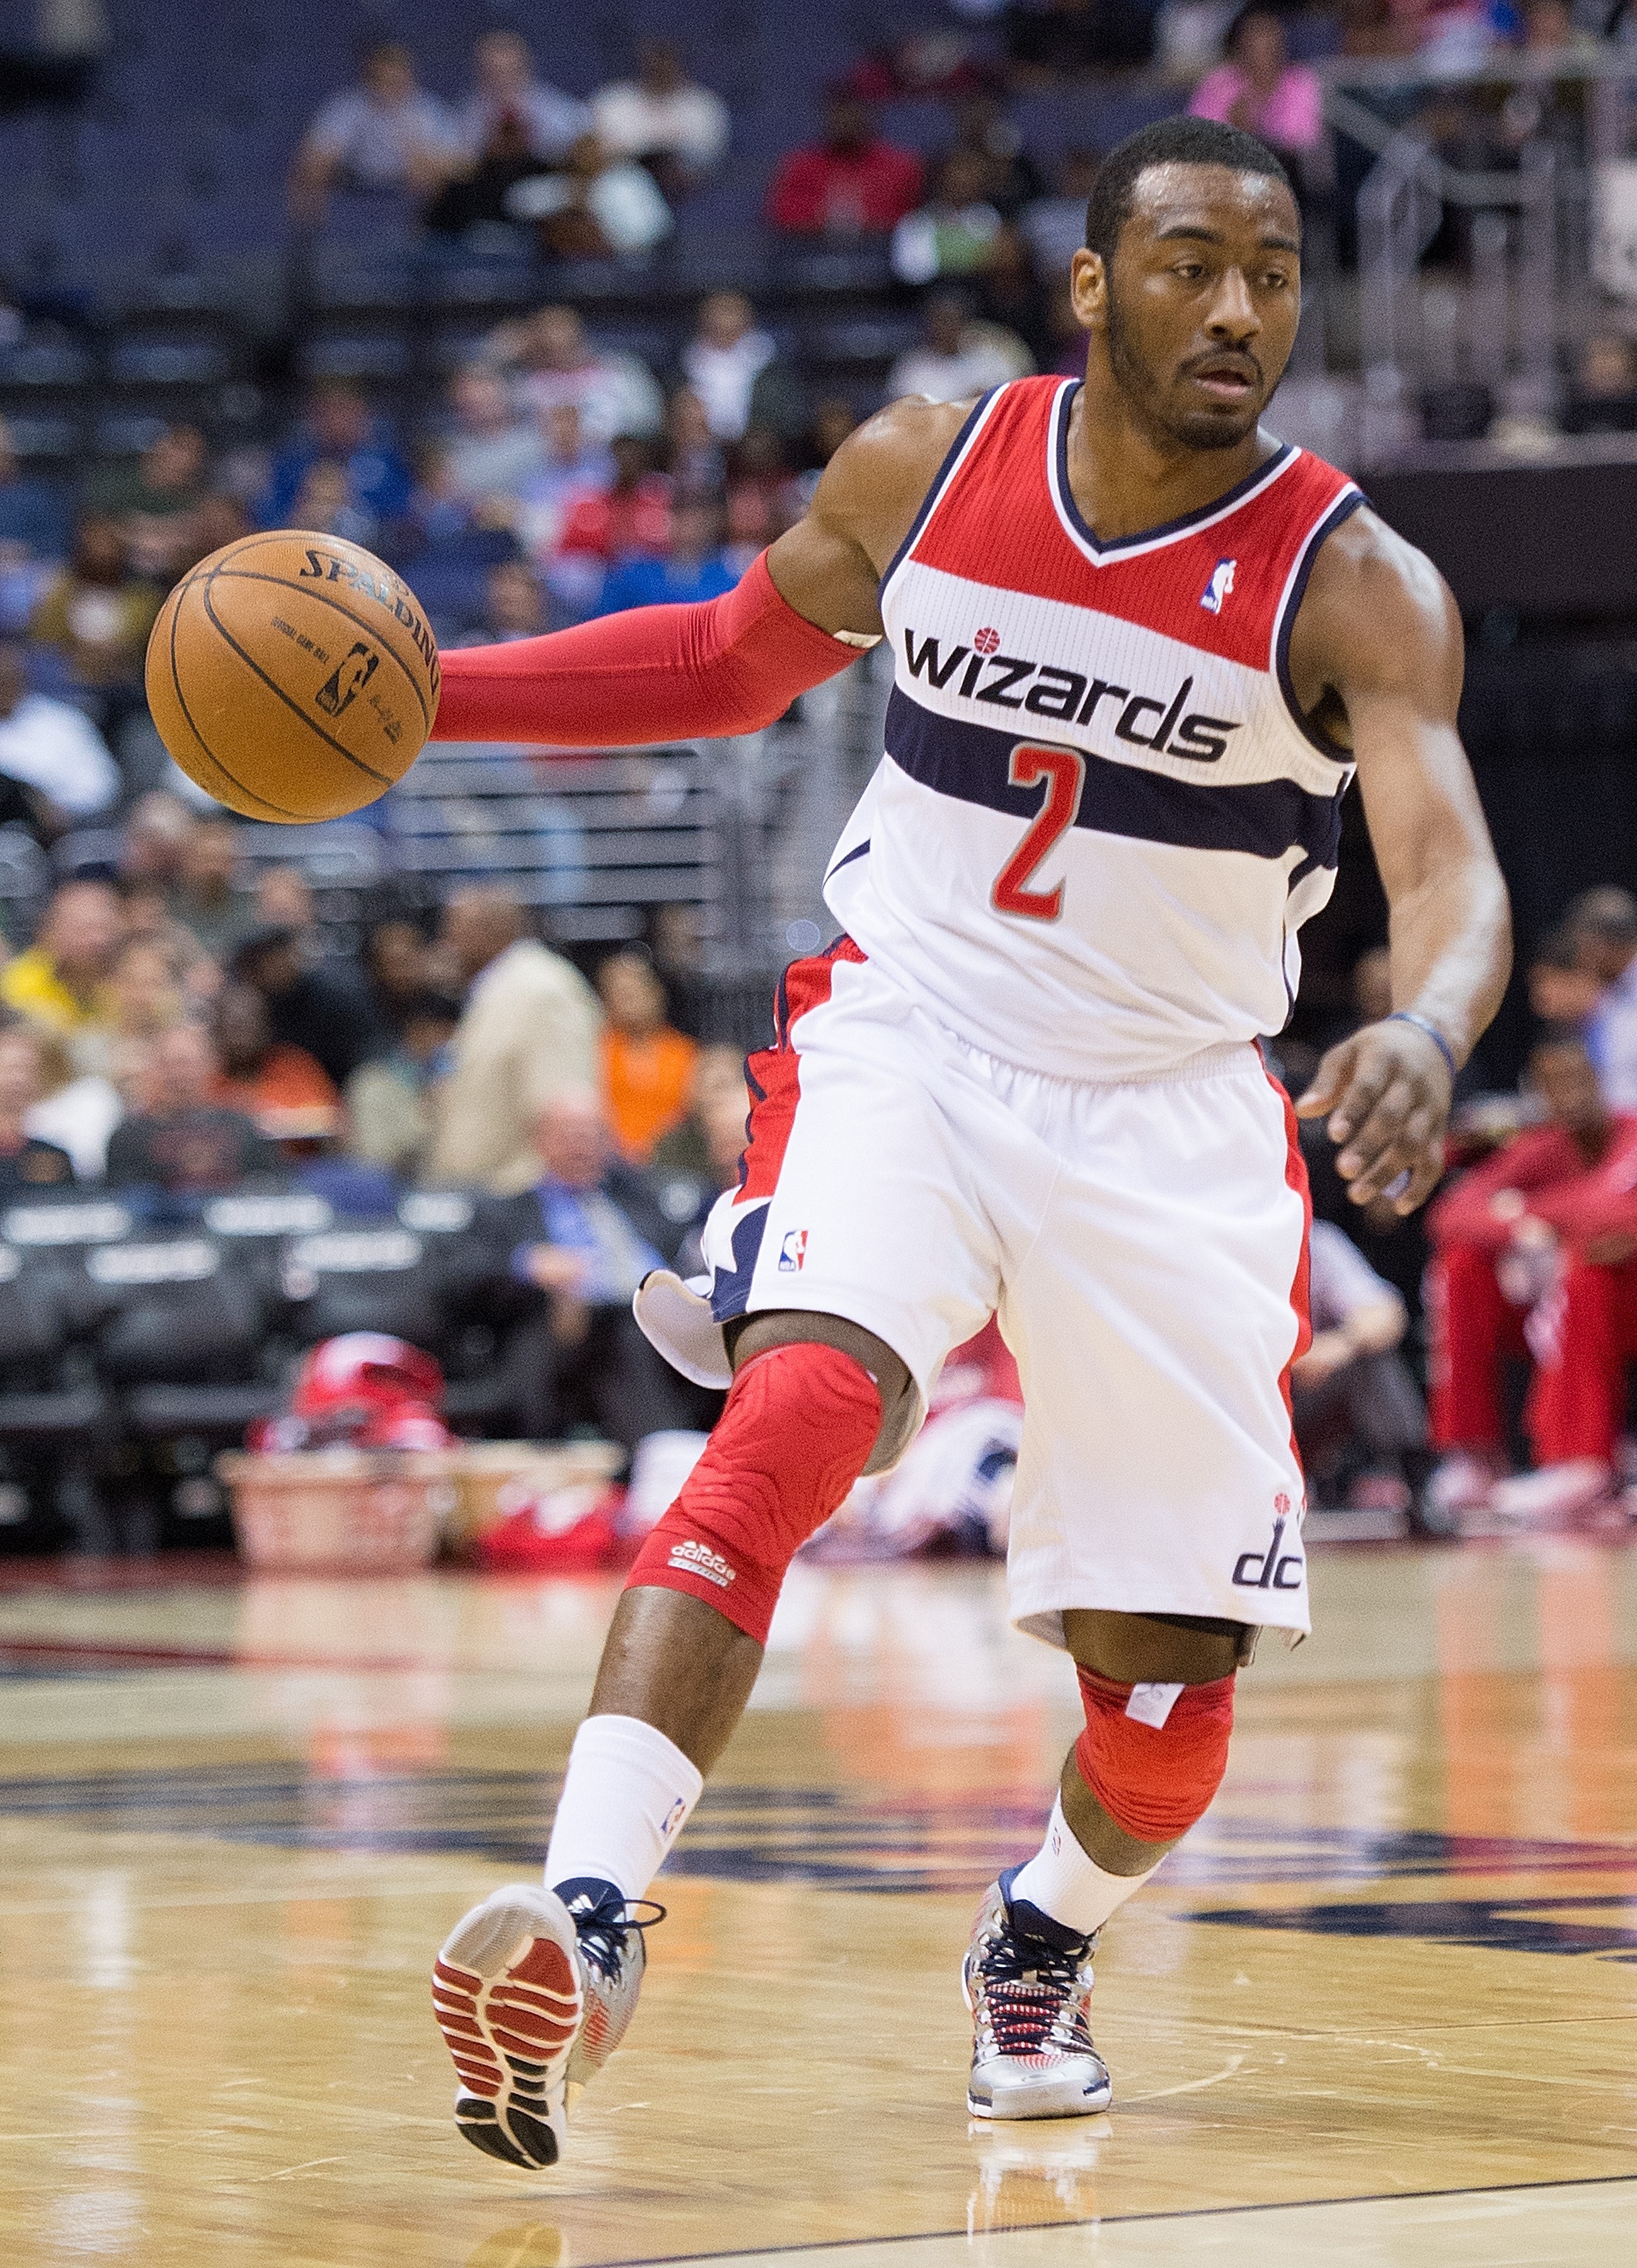
| John Wall | 51 | 36.1 | 153 | 129 | 136 | 168 | 157 | 157 | 149 | 144 | 142 | 146 |
| Otto Porter | 44 | 31.0 | 144 | 158 | 104 | 116 | 107 | 115 | 122 | 127 | 130 | 130 |
| Bradley Beal | 30 | 31.8 | 128 | 108 | 96 | 87 | 87 | 86 | 85 | 86 | 98 | 108 |
| Jared Dudley | 50 | 28.9 | 36 | 92 | 90 | 85 | 98 | 103 | 100 | 105 | 99 | 104 |
| Ramon Sessions | 51 | 20.4 | 131 | 119 | 84 | 90 | 87 | 89 | 88 | 91 | 90 | 89 |
| Jarell Eddie | 14 | 5.6 | – | – | – | – | – | 153 | 119 | 113 | 110 | 86 |
| Nene Hilario | 28 | 18.8 | 58 | 90 | 80 | 74 | 79 | 78 | 79 | 88 | 92 | 84 |
| Kris Humphries | 28 | 16.6 | 90 | 121 | 95 | 80 | 78 | 76 | 79 | 79 | 78 | 76 |
| Gary Neal | 40 | 20.2 | 23 | 49 | 64 | 75 | 78 | 74 | 75 | 78 | 71 | 70 |
| Garrett Temple | 49 | 25.6 | 38 | 106 | 57 | 54 | 70 | 63 | 68 | 79 | 79 | 69 |
| Drew Gooden | 22 | 12.4 | 99 | 51 | 57 | 56 | 56 | 56 | 38 | 47 | 34 | 31 |
| Kelly Oubre | 43 | 11.9 | -103 | -4 | -40 | -44 | 9 | 37 | 43 | 39 | 36 | 29 |
| DeJuan Blair | 29 | 7.5 | -345 | -129 | -112 | -45 | -34 | -38 | -38 | -28 | -6 | -15 |
| Ryan Hollins | 5 | 9.6 | – | – | -40 | 60 | 59 | – | – | – | – | – |
Beal has returned from injury playing well. Wall, Gortat and Porter continue to lead the team in production. The numbers indicate the Wizards actually have some decent professional players. What they lack is an elite producer. More on that coming tomorrow.