Wizards 2014 Playoffs Wrap-Up

NBA Washington Wizards vs Chicago Bulls Play-Offs Game 4
Trevor Ariza dominated in the playoffs despite low-blow karate chop from Mike Dunleavy.

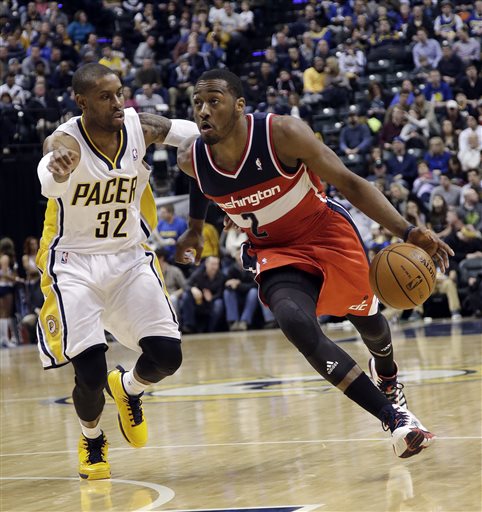
Just in time for the start of training camp, here’s a look back at the Wizards run in the playoffs this year. For those with short memories, Washington beat the Bulls in round one, and lost to the Pacers in round two. It was a good couple weeks for a franchise that’s been among the league’s worst the past several years.

I’ve finally gotten around to crunching the data to produce the Player Production Average (PPA) numbers. PPA is an overall rating metric I developed that credits players for things they do that help a team win, and debits them for things that don’t. It’s a per-minute stat that’s pace-neutral, accounts for defense, and includes a “degree of difficulty” factor based on the level of competition a player faces while on the floor. In PPA, 100 = average, higher is better, and 45 = replacement level.

Like any stat extracted from a small sample size, there’s a grain of salt factor. For example, Bradley Beal led the team with 458 playoff minutes — the cut when I look at regular season numbers is usually 500 minutes. Only 21 players reached 500 or more playoff minutes this year. That said, here are the numbers:

PLAYER GMS MPG RS PPA PS PPA
Trevor Ariza 11 37.0 145 193
Marcin Gortat 11 34.7 154 148
Bradley Beal 11 41.6 96 139
John Wall 11 38.2 139 82
Trevor Booker 9 16.2 123 75
Nene Hilario 10 32.5 102 49
Drew Gooden 10 14.6 106 37
Martell Webster 11 17.7 77 35
Andre Miller 11 9.8 86 12
Al Harrington 7 8.4 24 -22
Garrett Temple 10 .9 24 -33
Otto Porter 3 2.0 15 -49
Kevin Seraphin 4 1.5 35 -274

RS PPA = regular season

PS PPA = post-season

The numbers reflect Ariza’s tremendous playoffs performance. A 193 in the regular season would be worthy of All-NBA selection in most years. Among playoff performers with at least 100 total minutes, it ranked third overall behind Lebron James (263) and Chris Paul (211).

Gortat’s production improved as the playoffs went on. His first round PPA was a shade below average, but his play against Indy in round two pulled his full playoffs rating into the vicinity of his regular season performance.

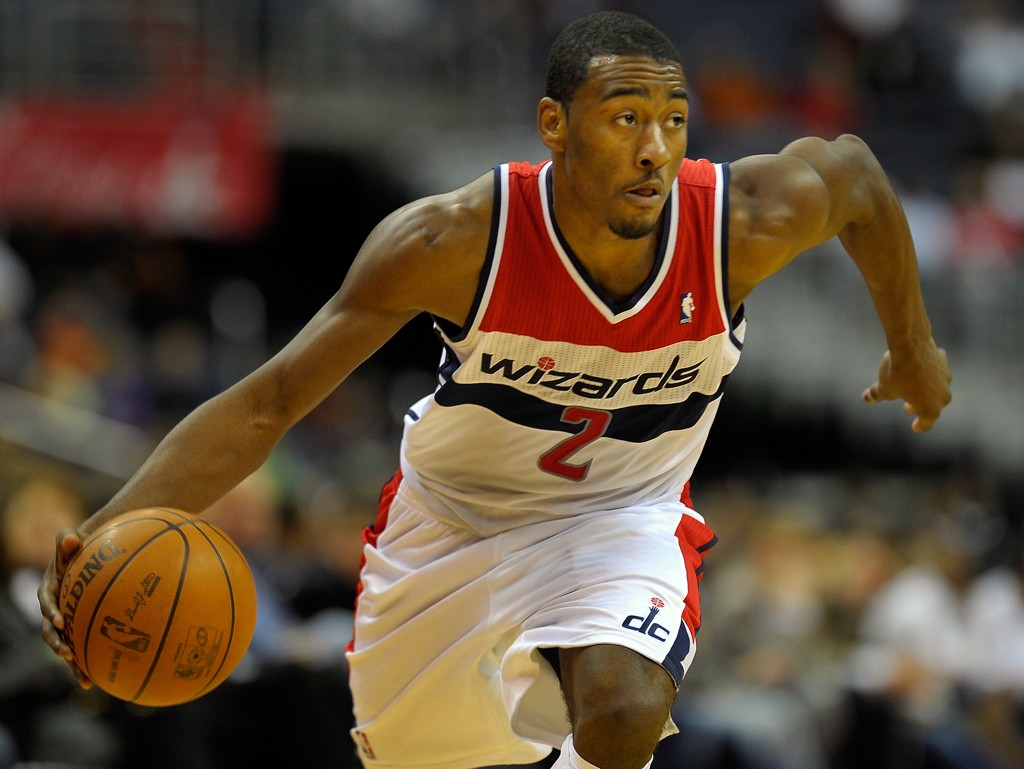
The team’s only other above-average playoffs producer was Beal, who was terrific in round one (152) and solid in round two. A promising post-season debut for a talented kid who will still be among the league’s youngest players when he starts his third season in a few weeks.

The post-season wasn’t so kind to Beal’s backcourt partner, John Wall. In the first round, Wall’s overall production wasn’t overwhelming, but he thoroughly outplayed Chicago’s guards. Indiana did a better job of forcing him out of comfortable plays, and Wall struggled.

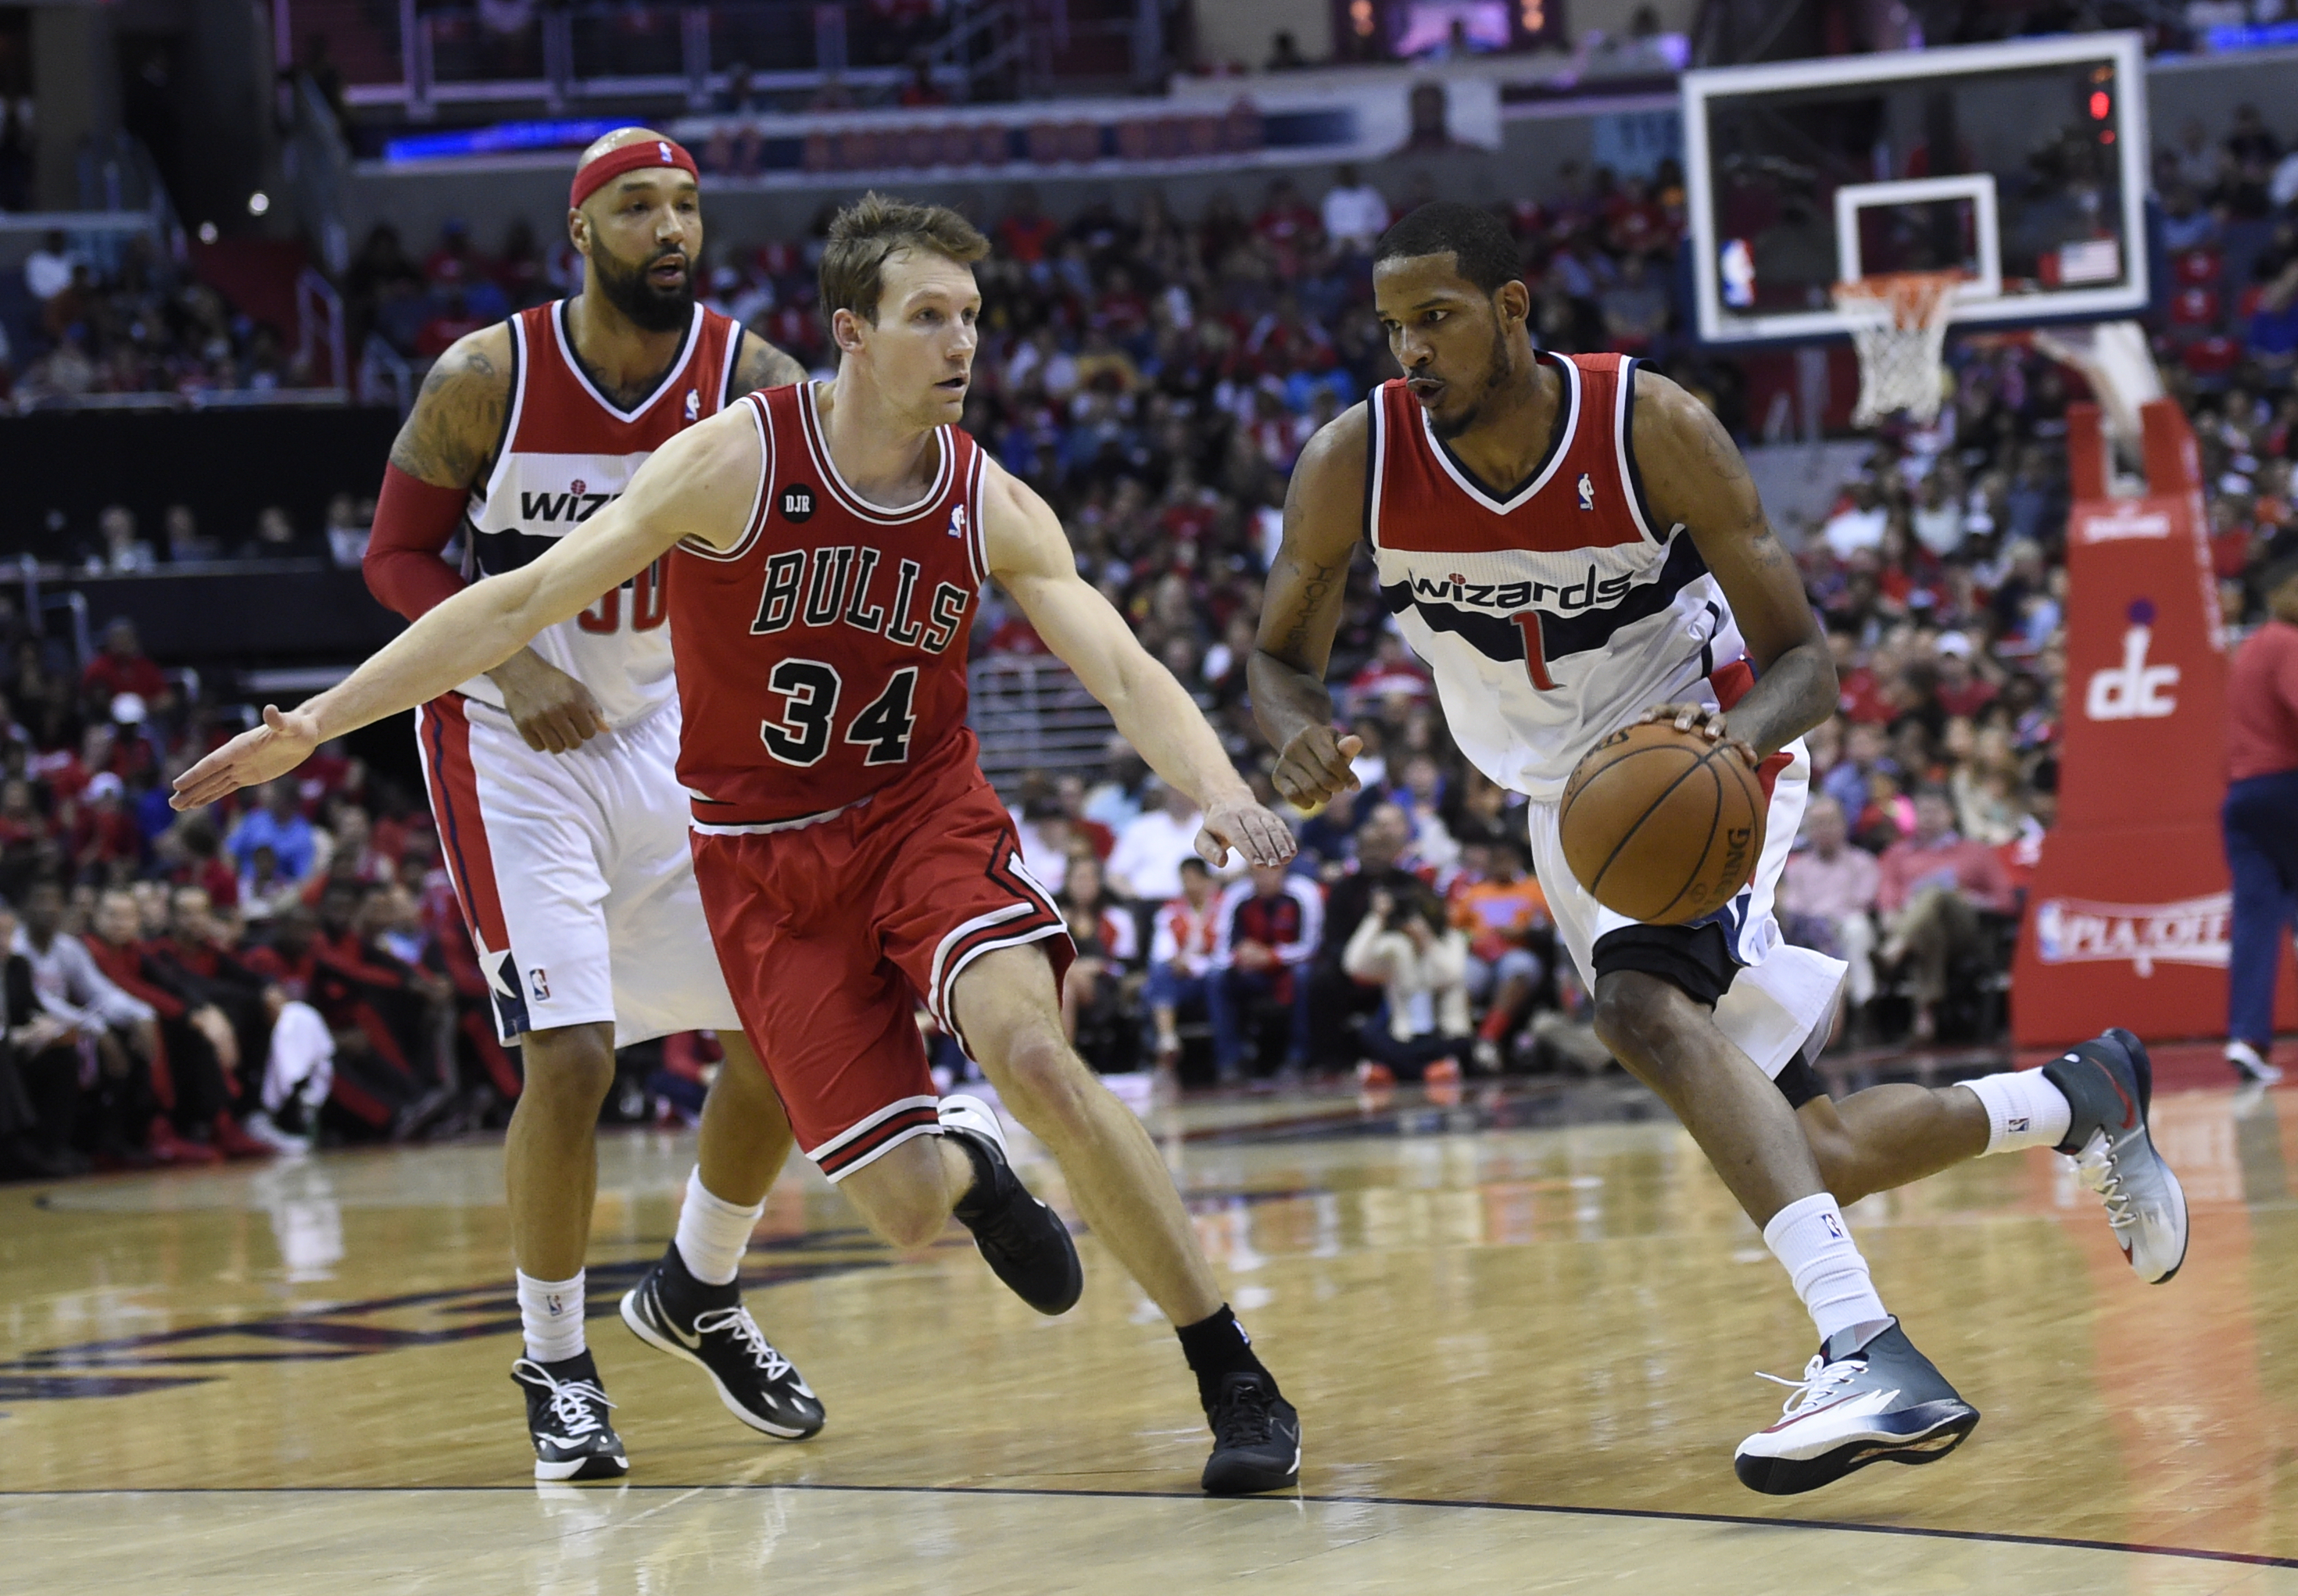
Now-departed Trevor Booker was solid in the first round, but played little in the second round. Friend of the blog Ben Becker wondered if Washington might have won against the Pacers if they’d played Booker instead of Gooden and/or Harrington. And, that’s definitely possible. The games were close and hard-fought, and the Wizards got next to nothing from Gooden and less than nothing from Harrington. Booker was fifth on the team in per minute production during the post-season, but 10th in round two minutes.

Against the Pacers, the Wizards got good production from Gortat, and little else from the front-court. Using the trio of Nenê, Gooden and Harrington with so little court time for Booker may well have cost Washington a trip to the Eastern Conference Finals.

Similarity scores coming soon.

That Path to the Eastern Conference Finals

partingredsea08

In my last post, I alluded to a kind of parting of the seas for the Wizards in the Eastern Conference playoffs. The reasoning is pretty simple: the Wizards should be considered strong favorites over either the Pacers or the Hawks. That’s right, either.

If this was a “normal” NBA season, Washington would be a heavy underdog to the top seeded Pacers. But, if this was a “normal” season, the Wizards wouldn’t have been the fifth seed with 44 wins, Atlanta wouldn’t have been in the playoffs with a sub-.500 record, and Indiana wouldn’t have disintegrated over the last two months of the season (and wouldn’t have had to fight and claw to get to a seventh game against such a pedestrian opponent).

This is an abnormal season, though, and the weak Eastern Conference coupled with the stumble-bum Pacers at the top have given the Wizards their best chance of reaching the NBA’s final four since…1979.

That the Wizards would be favored vs. Atlanta is unsurprising. The Hawks weren’t much good during the regular season. They struggled after center Al Horford tore a pectoral muscle (again), and limped into the playoffs. The Pacers need a bit more explanation — which I provided nearly a month ago when I wondered whether Washington should tank for seventh so they could face Indiana in the first round.

If you want more detail, please click and read on that link. The upshot is this: since the All-Star break, the Pacers have been a very different team. They’ve actually had a negative scoring differential, which is something I don’t think I’ve ever seen for an extended stretch from a highly seeded team. Indeed, since the All-Star break, the Pacers have had the scoring differential of a 34-win team (over an 82-game schedule), just one game better than the eighth seed Hawks. Over that same time frame, Washington’s differential was that of a 52-win team.

Don’t go getting too excited about that differential: the Wizards played an incredibly easy schedule after the All-Star break. Still, it’s illustrative of the significant changes in the Eastern Conference. Since that All-Star break, the Wizards had the third best efficiency differential of the East’s playoff teams. The Pacers had the second worst.

So, what are the odds? Applying a combination of full season numbers, post All-Star break numbers, and playoff performance, I estimate Washington having the following chances of beating these possible Eastern Conference playoff opponents:

  1. Indiana — 64%
  2. Miami — 27%
  3. Toronto — 50%
  4. Chicago — 100%
  5. Washington — 0%
  6. Brooklyn — 67%
  7. Charlotte — eliminated
  8. Atlanta — 81%

The odds will fluctuate a bit after that seventh game, but the fundamental point remains: Washington is in a terrific position to reach the Eastern Conference Finals. Getting farther is a dicier proposition, especially if they end up facing Miami.

Round One Wrap-Up

The 4-1 first round win over the Chicago Bulls is done, but there are still a few points worth making. While there’s been some chatter about how flawed the Bulls are (including by me), Chicago actually looked pretty strong entering the post-season. It’s trademark defense was excellent down the stretch, and its offense was about average. The Eastern Conference team with the best efficiency differential after the All-Star break? The Bulls.

Washington’s first round victory wasn’t a case of getting a crappy opponent, it was a case of the Wizards outplaying a decent team. Give credit where it’s due: a big reason the Bulls looked so bad is that the Wizards were on their game.

Finally, here’s a look at the Player Production Averages (PPA) for the series. PPA is an overall rating metric I developed that credits players for things they do that help a team win, and debits them for things that don’t. It’s a per-minute stat that’s pace-neutral, accounts for defense, and includes a “degree of difficulty” factor based on the level of competition a player faces while on the floor. In PPA, 100 = average, higher is better, and 45 = replacement level. (Don’t pay much attention to the extreme scores at the bottom of the table — tiny sample sizes don’t mean much of anything.)

TEAM Player GMS MPG PPA
CHI Taj Gibson 5 30.8 210
WAS Trevor Ariza 5 39.0 193
WAS Bradley Beal 5 41.0 152
CHI Mike Dunleavy 5 32.6 139
WAS Trevor Booker 5 24.2 134
WAS John Wall 5 38.6 128
WAS Martell Webster 5 18.0 113
WAS Nene Hilario 4 35.8 107
CHI Joakim Noah 5 42.0 97
WAS Marcin Gortat 5 36.0 97
CHI Jimmy Butler 5 43.6 88
CHI Carlos Boozer 5 24.2 58
CHI Kirk Hinrich 5 33.4 22
WAS Andre Miller 5 10.4 10
CHI D.J. Augustin 5 28.2 5
WAS Kevin Seraphin 1 1.0 0
WAS Drew Gooden 4 9.0 -35
CHI Tony Snell 5 9.2 -47
CHI Nazr Mohammed 2 2.5 -189
WAS Al Harrington 3 2.3 -364
WAS Garrett Temple 4 0.3 -1889

Interesting that the most productive player in the series was Taj Gibson, who played just 30.8 minutes per game. Meanwhile, Chicago started Carlos Boozer and played him 24.2 minutes per game despite production that wasn’t much better than replacement level.

Also interesting to me is how the production numbers differ from popular perception. One “experts” poll named Nenê as Washington’s first round “MVP.” When it comes down to doing the things that cause teams to win, he rated sixth best for the Wizards — behind Ariza, Beal, Booker, Wall and Webster.

In total, eight players rated “above average” in this series. Six of those players wore Wizards uniforms. While Gibson was good throughout the series, the only other Bull above average was Dunleavy, and most of his production came in a single game.

Path Opening for Wizards to Make Deep Playoff Run

Ariza dominating

As enjoyable as the Wizards-Bulls series has been so far (for Wizards fans, at least), there’s a tangible feeling that Washington has drawn to an inside straight. (That’s a fancy poker way of saying they’ve gotten lucky.) Yes, I’m aware the Wizards have looked good in the playoffs — teams look good when they win.

I’m also aware that the “experts” at ESPN and TNT (and elsewhere) have declared this Washington as a near-perfect squad with “no weaknesses.” But, much (most?) of the commentary has been a veritable catalog of cognitive biases. Over the course of six months and 82 games, the Wizards were average. A perfectly average team playing against their schedule would be expected to win 43-44 games. They won 44. That’s not a team without weakness — it’s an average team.

In the playoffs, they’re beating the Bulls — a slightly better than average team overall this season, but also a team with a major flaw: one of the league’s worst offenses.

Meanwhile, the Indiana Pacers have continued their post-All-Star break swoon and are struggling to keep pace with the sub.500 Atlanta Hawks. The Wizards should be favored against either team in a second round matchup. Which would put Washington into the conference finals against (probably) the Miami Heat.

It’s the 2013-14 NBA Eastern Conference, where being meh is good enough because nearly everyone else is meh-er.

In many ways, the Wizards this season are a fascinating experiment in perception. On one hand, there’s a solidly average regular season and no top-end production. On the other hand, there’s a likely first-round win against the Bulls and a good chance they make a run to the Eastern Conference Finals.

Folks in the “they’re really not that good” camp can point to the historically weak conference and Indiana’s meltdown, which carved out the path. But…it’s not Washington’s fault their opponents suck. The only thing they can do is play their game and beat whoever’s put in front of them. Being average when others are bad might be a functional equivalent of being good.

For me, it’s clear that the Wizards are an average team that’s drawn a flawed opponent in the first round and has a very good chance of getting a flawed opponent in the second round as well. That said, being average this season and next is probably good enough to hang around in the playoffs for the next year or two before Washington’s older players decline and other teams rebuild sufficiently. Washington won’t be a realistic title contender (even if they make the Eastern Conference Finals), but it’ll be fun to see them playing in May.

In other words, have fun, but don’t go overboard revising conclusions drawn from six months and 82 games worth of data over a few weeks against a couple opponents. What would be cause for some revision? Beating the Heat and making it to the Finals.

At any rate, here are a couple looks at the Wizards-Bulls first round series through the first four games. First up, here’s Player Production Average. PPA is an overall evaluation stat I developed. It’s designed to credit players for things they do that help a team win and “debit” them for things that don’t — each in proper proportion. It’s a pace-adjusted, per minute stat that accounts for defense and includes a degree of difficulty factor based on the level of competition a player faces while on the floor. In PPA, 100 = average, higher is better and 45 = replacement level.)

Player TEAM G MPG PPA
Taj Gibson CHI 4 32.3 215
Trevor Ariza WAS 4 39.5 212
Mike Dunleavy CHI 4 32.3 168
Bradley Beal WAS 4 40.8 161
Martell Webster WAS 4 18.5 135
John Wall WAS 4 38.5 121
Trevor Booker WAS 4 24.5 99
Marcin Gortat WAS 4 36.8 86
Joakim Noah CHI 4 41.8 85
Carlos Boozer CHI 4 23.3 76
Nene Hilario WAS 3 34.7 74
Jimmy Butler CHI 4 43.8 70
Andre Miller WAS 4 10.8 63
D.J. Augustin CHI 4 29.5 43
Kirk Hinrich CHI 4 32.0 0
Kevin Seraphin WAS 1 1.0 0
Drew Gooden WAS 4 9.0 -33
Tony Snell CHI 4 10.3 -59
Nazr Mohammed CHI 2 2.5 -180
Al Harrington WAS 3 2.3 -346
Garrett Temple WAS 3 0.3 -1408

The top two producers have been Taj Gibson and Trevor Ariza. Mike Dunleavy’s high rating is largely a product of a single terrific game in a small sample size. Bradley Beal is having a good series. John Wall and Martell Webster have also been solid.

Folks have gotten excited about Nenê’s play, but the big man hasn’t really played all that well outside of game one.

Want to see why Chicago is struggling? Their only above average performers in these four games have been Gibson and Dunleavy. Noah, Boozer and Butler have been subpar. Augustin and Hinrich have been wretched — especially Hinrich who has given the Bulls 32.0 minutes per game of nothing.

Last, here’s a look at estimated wins added (call them eWins) for the series:

Player TEAM G MPG eWINS
Trevor Ariza WAS 4 39.5 0.68
Taj Gibson CHI 4 32.3 0.56
Bradley Beal WAS 4 40.8 0.53
Mike Dunleavy CHI 4 32.3 0.44
John Wall WAS 4 38.5 0.38
Joakim Noah CHI 4 41.8 0.29
Marcin Gortat WAS 4 36.8 0.26
Jimmy Butler CHI 4 43.8 0.25
Martell Webster WAS 4 18.5 0.20
Trevor Booker WAS 4 24.5 0.20
Nene Hilario WAS 3 34.7 0.16
Carlos Boozer CHI 4 23.3 0.14
D.J. Augustin CHI 4 29.5 0.10
Andre Miller WAS 4 10.8 0.05
Kirk Hinrich CHI 4 32.0 0.00
Kevin Seraphin WAS 1 1.0 0.00
Nazr Mohammed CHI 2 2.5 -0.02
Drew Gooden WAS 4 9.0 -0.02
Garrett Temple WAS 3 0.3 -0.03
Tony Snell CHI 4 10.3 -0.05
Al Harrington WAS 3 2.3 -0.05

This eWins approach uses total production to estimate each player’s individual share of team wins. It works reasonably well over the full season. For the series, it has the Wizards with a 2.4 to 1.7 eWins lead, which is reflective of a couple very close games (Washington’s overtime win in game two, and Chicago’s narrow game three victory.)

Wizards Slouching Toward the Playoffs

The numbers in the table below are this week’s Player Production Average (PPA) update. PPA is a metric I developed that credits players for things that contribute to winning and debits them for things that don’t — each in proper proportion. PPA is pace adjusted, accounts for defense and includes a degree of difficulty factor. In PPA, 100 = average, higher is better and 45 = replacement level. PPA is a per minute stat.

PLAYER GMS MPG LW PPA
Marcin Gortat 77 32.9 150 153
Trevor Ariza 73 35.7 151 143
John Wall 78 36.6 141 138
Trevor Booker 68 21.4 115 119
Drew Gooden 20 18.6 127 114
Nene Hilario 50 29.9 101 100
Andre Miller 24 14.4 104 91
Bradley Beal 69 34.7 89 89
Martell Webster 74 28.1 82 80
Jan Vesely 33 14.2 68 68
Kevin Seraphin 50 11.4 35 37
Chris Singleton 24 10.4 34 32
Garrett Temple 71 8.9 25 25
Glen Rice 11 9.9 20 20
Otto Porter 33 8.2 13 19
Al Harrington 30 14.9 13 8
Eric Maynor 23 9.3 8 8

Rough week for the Wizards, which is reflected in the individual numbers. On the positive side were Marcin Gorat, (who continues to have a good season), Trevor Booker (who many fans want removed from the rotation), and Otto Porter (who performed better, but still rates well below replacement level).

Even with a bad week, Trevor Ariza is having a career season. He gets a bit of a pass for the last few games — he’s been beset with the flu, and really shouldn’t have even been on the floor.

John Wall’s production fell for a third straight week. It’s been fashionable to celebrate Wall’s improvement and his ascendancy to All-Star status, but it’s worth noting that his 138 PPA this season is virtually identical to the 139 he posted last year.

Here’s a visualization of each player’s PPA through the season. Since this is basically a weekly rolling season average, the larger fluctuations at the beginning followed by a flatter line toward the end is to be expected. Note the fairly steady climb of Gortat’s PPA — he’s been playing better as the season has progressed. The production slip from Wall the past three weeks is also apparent.

Check out the steady production from Booker. Webster’s season-long decline is apparent in his graph.

Drew Gooden’s production has fallen steeply after a hot start. He may not be the godsend Wizards fans had hoped for. Andre Miller’s play has been up and down, but at least sorta trending up.

ppa trend

Wizards Weekly: Playoffs Clinched

wall past carmelo

Since the Wizards cemented a spot in this year’s playoffs, I’m going to focus more on the stellar play of Trevor Ariza and Marcin Gortat, and sorta gloss over the things that bug me a bit in this week’s numbers.

Some positives:

  • Al Harrington had a good enough week that he no longer rates as the league’s least productive power forward. That honor belongs to Brandon Davies.
  • Marcin Gortat’s PPA rose to 150 — the highest its been since December 11.
  • I missed it last week, but the Wizards have no one with a negative PPA. The team’s least productive player is Eric Maynor, but he’s not in the NBA after being released by Philadelphia.
  • Otto Porter scored nine points in five minutes, and added 10 points to his PPA.

Below is this week’s Player Production Average (PPA) update. PPA is a metric I developed that credits players for things that contribute to winning and debits them for things that don’t — each in proper proportion. PPA is pace adjusted, accounts for defense and includes a degree of difficulty factor. In PPA, 100 = average, higher is better and 45 = replacement level. PPA is a per minute stat.

PLAYER GMS MPG LW PPA
Trevor Ariza 70 35.7 151 151
Marcin Gortat 74 32.7 145 150
John Wall 75 36.6 144 141
Drew Gooden 17 18.9 148 127
Trevor Booker 65 21.0 116 115
Andre Miller 21 14.8 81 104
Nene Hilario 49 30.1 101 101
Bradley Beal 66 34.5 90 89
Martell Webster 71 28.2 81 82
Jan Vesely 33 14.2 68 68
Kevin Seraphin 49 11.5 36 35
Chris Singleton 23 10.7 40 34
Garrett Temple 69 9.1 22 25
Glen Rice 11 9.9 20 20
Al Harrington 28 15.5 1 13
Otto Porter 32 8.2 3 13
Eric Maynor 23 9.3 8 8

Okay, I can’t help myself — now for the stuff that worries me:

  • Wall’s PPA is down to 141. That’s a good score, but his PPA last season was 139. And his offensive efficiency has slipped back below average.
  • Gooden’s PPA dropped sharply this week. His efficiency numbers are still insanely good — heck, all his numbers are, except for defense. There are way too many defensive breakdowns when he’s on the floor, and he continues to lose points in the defense portion of PPA.
  • Beal and Webster both rate solidly below average. This isn’t a surprise — Beal’s still a kid trying to figure out his spot in the league, and Webster is basically regressing to his mean this season. But, it does mean the Wizards aren’t getting a ton of production from their SG — and both rate as below average defenders.


The Briefest of Wizards Updates

In keeping with established Wizards traditions, Al Harrington is currently the NBA's least productive PF.
In keeping with established Wizards traditions, Al Harrington is currently the NBA’s least productive PF.

Don’t have a ton of time for fancy prose — not with friend of the blog Ben Becker inviting himself to be a guest blogger next week and filling my inbox with questions.

So…here’s this week’s Player Production Average (PPA) update. PPA is a metric I developed that credits players for things that contribute to winning and debits them for things that don’t — each in proper proportion. PPA is pace adjusted, accounts for defense and includes a degree of difficulty factor. In PPA, 100 = average, higher is better and 45 = replacement level. PPA is a per minute stat.

PLAYER GMS MPG LW PPA
Trevor Ariza 66 36.0 154 151
Drew Gooden 13 17.5 152 148
Marcin Gortat 70 32.9 147 145
John Wall 71 36.8 146 144
Trevor Booker 61 21.1 116 116
Nene Hilario 49 30.1 103 101
Bradley Beal 62 34.4 88 90
Andre Miller 17 14.3 75 81
Martell Webster 67 28.4 84 81
Jan Vesely 33 14.2 69 68
Chris Singleton 22 11.0 40 40
Kevin Seraphin 47 11.8 40 36
Garrett Temple 66 9.4 23 22
Glen Rice 11 9.9 21 20
Eric Maynor 23 9.3 8 8
Otto Porter 31 8.3 3 3
Al Harrington 24 15.0 -2 1

Unsurprisingly given the team’s record during their recent series against the Western Conference, the production of their top players was down a little across the board. Nothing major — just…the kind of thing to be expected when they face some tougher competition than they get in the East.

I don’t know how much Martell Webster’s back is bothering him, but his production is way down this season. Last season, he posted a career-best PPA of 114. This season, he’s back down at his career level. This is cause for concern.

Also, I’ve heard/seen folks in a variety of places refer to the Wizards as a “young team.” But….not so. They’re right at the league average in age, but their rotation at this point is older. I’ll probably look at this in greater detail next week, but consider this:

  • The team’s plan was “build through the draft,” but only three of their rotation players (Wall, Beal and Booker) were selected by the Wizards.
  • Those same three players are the team’s only rotation players younger than league average.
  • Once Nenê returns they’ll have more rotation guys age 30 or older (four) than they do under age 26 (three).

The team does have young players on the roster, but they’ve been decidedly unproductive this season — for much of their careers for most of them.

In keeping with Wizards tradition, Al Harrington currently rates as the NBA’s least productive PF (minimum 300 minutes). Last season, that title was held by Jan Vesely.

Wizards Enjoy Soft Schedule Without Nenê

drew gooden

The Wizards have run their “without Nenê” record to 5-2 — a subject well-covered by the Washington Post’s Michael Lee this morning. Lee even broke out “points per 100 possessions,” which was nice to see. My only quibble with the story was that it didn’t mention Washington’s ultra-soft schedule, which may have ended up on the cutting room floor as editors tried to make the story fit into their print edition.

Here’s a quick look at the Wizards season — rolling averages of their offensive and defensive ratings (points scored/allowed per 100 possessions), as well as pace (possessions per 48 minutes).

2013-14 Wizards -- rtg & pace rolling
Red = defensive rating
Green = offensive rating
Dark blue = pace
Light blue = league average offensive rating
Orange = date of Nenê’s knee injury

That the Wizards have had a nice run without Nenê shouldn’t be much of a surprise. His overall play (see the PPA table below) has been mediocre, and while he’s helped the team on defense, he’s hurt them on offense. And, the Wizards have faced a series of cupcake opponents — four of their last seven have been in full tank mode. Their win against Toronto is the only one that could be considered a surprise. Even using the Nenê on/off numbers from the date he got hurt, the Wizards should have been expected to win at least four.

What have the Wizards done differently without their big man? They’ve been WAY more efficient on offense (115.3 points per 100 possessions over the last seven games vs. a season average of 105.7), but worse on defense (a defensive rating of 109.7 vs. 104.9 for the season).

The offense was largely expected. As noted previously, Washington has been more efficient without Nenê this season. The defense is worrisome. They got shredded by Orlando (28th ranked offense), Memphis (about average), and Milwaukee (27th on offense). The Heat also toasted them pretty good, but no shock — Miami boasts one of the league’s top three offensive units.

Also helping the Wizards get by without Nenê: the additions of Drew Gooden and Andre Miller. In still-tiny sample sizes for each, they’ve both been exactly what the team needed. Gooden has dominated opposing reserves — at least on the offensive end — and has provided much-needed rebounding and efficient scoring off the bench. Miller has been a steady veteran facilitator who somehow produces despite playing in “epic movie slow-motion” mode.

Miller’s production is sustainable — it’s about the same as what he was doing in Denver before he got sent home because of an argument with Nuggets coach Brian Shaw. Gooden’s production will almost certainly moderate, though he’s likely to still be useful the rest of the season. Gooden’s career PPA is 122, and he’s just two seasons removed from a 141. He’s never been this efficient on offense, though. And, his good play to this point is likely to earn him more minutes, which means he’ll end up facing more starters than he’s gone up against so far this season. Worth mentioning: his defense has long been a concern, and so far he grades out as well-below average in the defense part of PPA.

To the update. What is PPA? It stands for Player Production Average, which is a metric I developed that credits players for things that contribute to winning and debits them for things that don’t — each in proper proportion. PPA is pace adjusted, accounts for defense and includes a degree of difficulty factor. In PPA, 100 = average, higher is better and 45 = replacement level. PPA is a per minute stat.

PLAYER GMS MPG LW PPA
Trevor Ariza 58 35.9 159 159
Marcin Gortat 63 32.8 141 149
Drew Gooden 5 13.4 -146 149
John Wall 63 36.8 150 144
Trevor Booker 53 20.7 115 114
Nene Hilario 49 30.1 103 103
Andre Miller 9 13.7 52 96
Bradley Beal 54 33.9 93 94
Martell Webster 59 28.9 88 90
Jan Vesely 33 14.2 69 69
Chris Singleton 20 11.4 54 45
Kevin Seraphin 43 12.2 42 42
Garrett Temple 59 10.5 21 21
Glen Rice 11 9.9 21 21
Eric Maynor 23 9.3 8 8
Otto Porter 29 8.8 2 3
Al Harrington 16 15.3 -9 -6

Trevor Ariza continues to maintain a high level of play. In PPA, he ranks 4th in the league among SFs with at least 500 total minutes; third overall in total production. Marcin Gortat’s production ticked up this week, while John Wall’s went down.

I really think it’s time to shelve talk of Wall being a superstar. He’s very good and he has great potential, but there’s still a loooooooong ways to go for him to be considered an elite player.

Nice to see Martell Webster’s PPA go up slightly — the first time since December 17th that his PPA hasn’t dropped in one of my updates.

With or without Nenê, the week ahead could be a good one for the Wizards. My odds estimator suggests Washington should be favorites to win each of their next four games, although the matchups with Orlando and Sacramento fall into “coin flip” territory. Their odds of actually winning all four are only about 10%, but 3-1 is realistic.

The Anointing of John Wall

Folks have been tripping over each other to anoint John Wall a Genuine SuperStar and Franchise Savior since…well…before he even signed a contract. The Wizards literally gave him red carpet treatment when he arrived in DC after being made the number one selection. Since then, he’s been proclaimed as a star, as one of the game’s elite, and was awarded a max contract basically as soon as the Wizards could offer it.

Jason Reid’s still premature piece last week heralding Wall’s arrival as a “…true NBA star” seems nearly an example of restraint in comparison.

This blog post should not be read as “hate” for Wall. He has improved significantly since his first two seasons, and he has become good. He continues to possess elite (true star) potential, but despite the array of assertions that he already is a star…he’s not. Yet.

Before I go any further, it’s probably worthwhile for me to articulate what I mean by “star.” For me, it’s not a synonym for “well known” or “popular.” They’re guys consistently do the things that cause their teams to win games. Through the years, there have always been “media” stars — guys whose reputations exceed their actual production. Usually, they have high per game scoring averages — think Dominique Wilkins, Allen Iverson and (in recent years) Carmelo Anthony (although Anthony’s production has moved somewhat closer to his rep this season).

At 23 years old, Wall is decidedly NOT in that category. He’s a very good player now, and he’s on the cusp of greatness — if he continues to improve his jumper and cut down on turnovers. He could be one of the game’s elite in the very near future. He’s just not quite there yet.

Here are a few illustrations through the prism of the metric I developed, Player Production Average (PPA). PPA credits players for things that contribute to winning and debits them for things that don’t — each in proper proportion. PPA is pace adjusted, accounts for defense and includes a degree of difficulty factor. In PPA, 100 = average, higher is better and 45 = replacement level. PPA is a per minute stat.

First, let’s look strictly at point guards. In most seasons, it takes a PPA of 225 or higher to be an MVP candidate. Players scoring above 200 are among the game’s truly elite players. Here are this season’s top 10 PGs (minimum 500 minutes):

  1. Chris Paul — 250
  2. Stephen Curry — 197
  3. Goran Dragic — 175
  4. Kyle Lowry — 170
  5. Russell Westbrook — 166
  6. Mike Conley — 163
  7. Ty Lawson — 158
  8. John Wall — 150
  9. Tony Parker — 149
  10. Damian Lillard — 146

If I redo the analysis looking at totals instead of per minute production (to reward durability), Wall moves to fifth behind Curry, Lowry, Paul and Dragic.

Based on my analysis of Wall’s game and what I know of his work ethic and personality, I’d take his future over the future of anyone on the list ahead of him except Paul. But he needs to become more productive to become a truly elite PG.

Comparing Wall to the rest of the league, it’s hard to support the claim that he’s a “true star” (elite player). He’s top 20 in total production, in part because of he plays lots of minutes. In per minute production, he ranks just outside the top 40.

As I discussed a few weeks back, Wall’s positive contributions are plentiful — not unlike some of the game’s best players. But, his negative plays (poor shot selection, missed shots, and turnovers) are also abundant. I estimate that his shooting from the floor has cost the team 59 points so far this season — just under a point per game. That doesn’t sound like much, but over the course of 60 games it works out to about two more wins. Just two more wins at this point would have the Wizards tied with Chicago for the fourth seed, and just a half game behind Toronto for third.

‘Nuff said.

To this week’s PPA update:

PLAYER GMS MPG LW PPA
Trevor Ariza 55 36.0 155 159
John Wall 60 36.9 147 150
Marcin Gortat 60 32.9 144 141
Trevor Booker 50 20.6 112 115
Nene Hilario 49 30.1 103 103
Bradley Beal 51 33.8 94 93
Martell Webster 57 28.9 89 88
Jan Vesely 33 14.2 69 69
Chris Singleton 18 12.0 53 54
Andre Miller 6 13.8 88 52
Kevin Seraphin 43 12.2 43 42
Garrett Temple 56 10.9 20 21
Glen Rice 11 9.9 21 21
Eric Maynor 23 9.3 8 8
Otto Porter 26 8.8 -6 2
Al Harrington 13 14.2 12 -9
Drew Gooden 2 7.0 -146

Ariza and Wall continue to lead the way for the Wizards. Ariza is having a career-best season in his contract year. I have to think the Wizards would like to re-sign him, and I suspect Ariza’s more modest career production may keep his price more manageable.

Martell Webster’s PPA declined by one point — down for an eighth consecutive update. It’s good the team is giving him some days off to rest his ailing back, which is the likely cause for his production dip.

The new and returning old guys (Andre Miller, Drew Gooden and Al Harrington) were all awful since the last update.

It was good to see Otto Porter make some plays in the loss to Memphis. He’s back out of negative PPA territory, unlike number one overall pick Anthony Bennett whose PPA is -3.

A couple more entries in Small Sample Size theater: the departed Wizards. Jan Vesely’s PPA in Washington: 69. In 59 minutes for Denver: 58. PG Eric Maynor in Washington: 8. In 68 minutes for Philly: 48. That 48 was right around Maynor’s career average before signing with the Wizards. I still have no idea why the Washington front office thought he’d be good. Thankfully, he can now do a job for which he’s perfectly suited — helping Philadelphia lose games.

Andre Miller Is A Big Upgrade

wall dribbles

No time for anything in-depth today, but I wanted to get the numbers up. The Andre Miller trade is paying off already. In his first three games (and 44 minutes), Miller has been a bit more than four times as productive as Garrett Temple on a per minute basis.

John Wall, Trevor Ariza, Bradley Beal, and Marcin Gortat had good weeks. Trevor Booker did not. Martell Webster’s production declined for a seventh consecutive update.

The table below shows the just about weekly results of my metric: Player Production Average (PPA). PPA credits players for things that contribute to winning and debits them for things that don’t — each in proper proportion. PPA is pace adjusted, accounts for defense and includes a degree of difficulty factor. In PPA, 100 = average, higher is better and 45 = replacement level.

PLAYER GMS MPG LW PPA
Trevor Ariza 52 35.7 148 155
John Wall 57 36.8 140 147
Marcin Gortat 57 32.4 139 144
Trevor Booker 47 20.1 118 112
Nene Hilario 49 30.1 103 103
Bradley Beal 48 33.5 90 94
Martell Webster 55 28.8 91 89
Andre Miller 3 14.7 88
Jan Vesely 33 14.2 69 69
Chris Singleton 15 10.9 60 53
Kevin Seraphin 43 12.2 44 43
Glen Rice 11 9.9 21 21
Garrett Temple 54 11.2 20 20
Al Harrington 10 15.1 6 12
Eric Maynor 23 9.3 8 8
Otto Porter 24 8.9 -4 -6

Should the Wizards Fire Randy Wittman?

USP NBA: WASHINGTON WIZARDS AT DETROIT PISTONS S BKN USA MI

I was all set to write a piece arguing that it would be pointless to fire Randy Wittman. Yeah, he’s not a good coach, but in my view the team is performing about as I expected. The Wizards are neither good nor bad. They’re mediocre. Or, looked at another way, the Wizards are BOTH good and bad. Which is merely another way of saying the same thing: this is an average team.

They are what their talent says they are. I don’t believe that any coach could come in and transmogrify this roster into a…well…what exactly? a contender for the third seed? Blech.

What would “fix” the Wizards? Fewer two-point jumpers? More screen/roll with John Wall and Marcin Gortat? Better defined roles? A rotation that somehow includes developmental minutes for Otto Porter? A more solid defensive scheme? More consistent effort? Sure, any or all.

Some of that could be influenced by the coach, some not. My position has been that Wittman is a problem, not The Problem. And, “The Problem” is that the team doesn’t have enough talent, which is a result of a series of bad decisions by the front office. My thinking has been this: Don’t let Ernie Grunfeld off the hook. Make him live with the success or failure of the team he assembled — players AND coaches.

Except, let’s look at reality. Owner Ted Leonsis set the franchise goal for the season: Make the playoffs. In very large part because of a historically weak Eastern Conference, the Wizards will almost certainly accomplish that goal. While they’d be roughly the 11th best team in the West, they’re 5th or 6th best in the East. It would take a catastrophic collapse over their final 29 games to miss the postseason.

Assuming Leonsis is a man of his word, Grunfeld will be retained in the offseason. It’s difficult to envision a scenario in which Washington makes the playoffs and Leonsis doesn’t bring back Grunfeld and The Coach.

I use “The Coach” intentionally, because the question for Wizards fans is whether you want to root for a team that’s stuck with Grunfeld and Wittman or a team that’s stuck with Grunfeld and Someone Else. My feeling is that Someone Else — whether it’s an interim coach who’s replaced by a “permanent” hire after the season or whether it’s an interim coach who “succeeds” and keeps the job — will be a better long-term option for the Wizards than Wittman.

So, even though Wittman has been saddled with a roster that doesn’t include a single player that ranks among the league’s 40 most productive players (Trevor Ariza is the highest rated Wizards player at 44), count me among the fans who’d like to see a new coach. Now.

Moving on to the update…  The table below presents results from my Player Production Average (PPA) metric. PPA credits players for things that contribute to winning and debits them for things that don’t — each in proper proportion. PPA is pace adjusted, accounts for defense and includes a degree of difficulty factor. In PPA, 100 = average, higher is better and 45 = replacement level.

PLAYER GMS MPG LW PPA
Trevor Ariza 48 35.8 152 148
John Wall 53 37.1 149 140
Marcin Gortat 53 32.4 139 139
Trevor Booker 43 20.2 125 118
Nene Hilario 46 30.3 103 103
Martell Webster 51 29.1 94 91
Bradley Beal 44 33.2 86 90
Jan Vesely 32 14.7 72 69
Chris Singleton 14 10.6 60 60
Kevin Seraphin 40 11.8 32 44
Glen Rice 11 9.9 21 21
Garrett Temple 51 11.5 13 20
Eric Maynor 23 9.3 8 8
Al Harrington 7 18.6 6 6
Otto Porter 23 9.3 4 -4

When looking at these numbers, keep in mind that PPA scores in the 140-150 range (like Ariza and Wall) are nowhere near elite levels of production. A typical MVP-quality season would have a PPA of 230 or better. This season’s MVP is likely to be Kevin Durant with a PPA of 261 (so far). Last season, Lebr0n James posted the best PPA in my database with a 284.

Wall had a feel-good All-Star weekend winning the dunk contest and playing well in the game. But, if he played in the West, he wouldn’t have been part of the All-Star discussion. He continues to have All-World potential, but his actual production is good — not great.

Biggest improvers in this update were Kevin Seraphin and Garrett Temple. Seraphin is now at replacement level. Temple continues to be among the league’s weakest PGs, but is at least a little less bad than he’d been.

Wall’s performance slumped leading into the All-Star break. Perhaps he was distracted by the coming festivities? Nenê’s production continues to hover around league average. Martell Webster’s play declined for a sixth consecutive update.