Wizards Update: Designed to Piss Off Charles Barkley

Drew Gooden celebrates being the biggest improver in this week's Player Production Average update.
Drew Gooden celebrates being the biggest improver in this week’s Player Production Average update.

Charles Barkley doesn’t like analytics. His argument works out to this: “I don’t know anything about analytics and I never will. Also, you stat people never played the game and couldn’t get girls in high school.”

Partial credit to the new number one on my list of people I’d like to meet at a poker table — I didn’t “get girls” in high school, perhaps because I was too busy playing basketball.

Of course, if we apply Barkley’s fatuous logic that only people who have played the game are qualified to offer opinions about the game, then only people who have done analytics would be qualified to offer opinions about analytics. Which means, by Barkley’s own Rules of Living, we should all shut the hell up — on a lot of things. Hmm, maybe he’s on to something.

Despite Barkley’s assertion that “analytics don’t work,” the facts are that in recent years, top teams have made extensive use of analytics to improve their teams. Of course, there are crappy teams that use analytics, but the same was true when teams were built by Men Who Stared At Players.

Analytics are not an end to themselves, and they’re not intended to eliminate people from decision-making. They’re tools to help inform decisions — sorta like being able to estimate odds in poker. You’re playing both the cards and the people across the table, but it’s a sucker who wagers without a good sense for their chances of winning. Which reminds me that Barkley really sucks at gambling.

Speaking of analytics, the Wizards could use some help. Despite dominating wins over sad-sack Brooklyn and Orlando, there’s a pervasive sense of gloom about the team lately. Since starting the season 22-8, they’re 11-13. The struggles weren’t a shock — it was the toughest part of the team’s schedule.

Heading into the All-Star break, areas for concern are much the same as they were when I wrote about them more than a month ago:

  • Age — Production has dropped significantly over the past month for the team’s oldest players, Paul Pierce and Andre Miller. Nenê has been doing better, but remains below average for a starter. The team has been terrific with him on the floor, however. And, in the “no shock” category, Rasual Butler’s production has dropped.
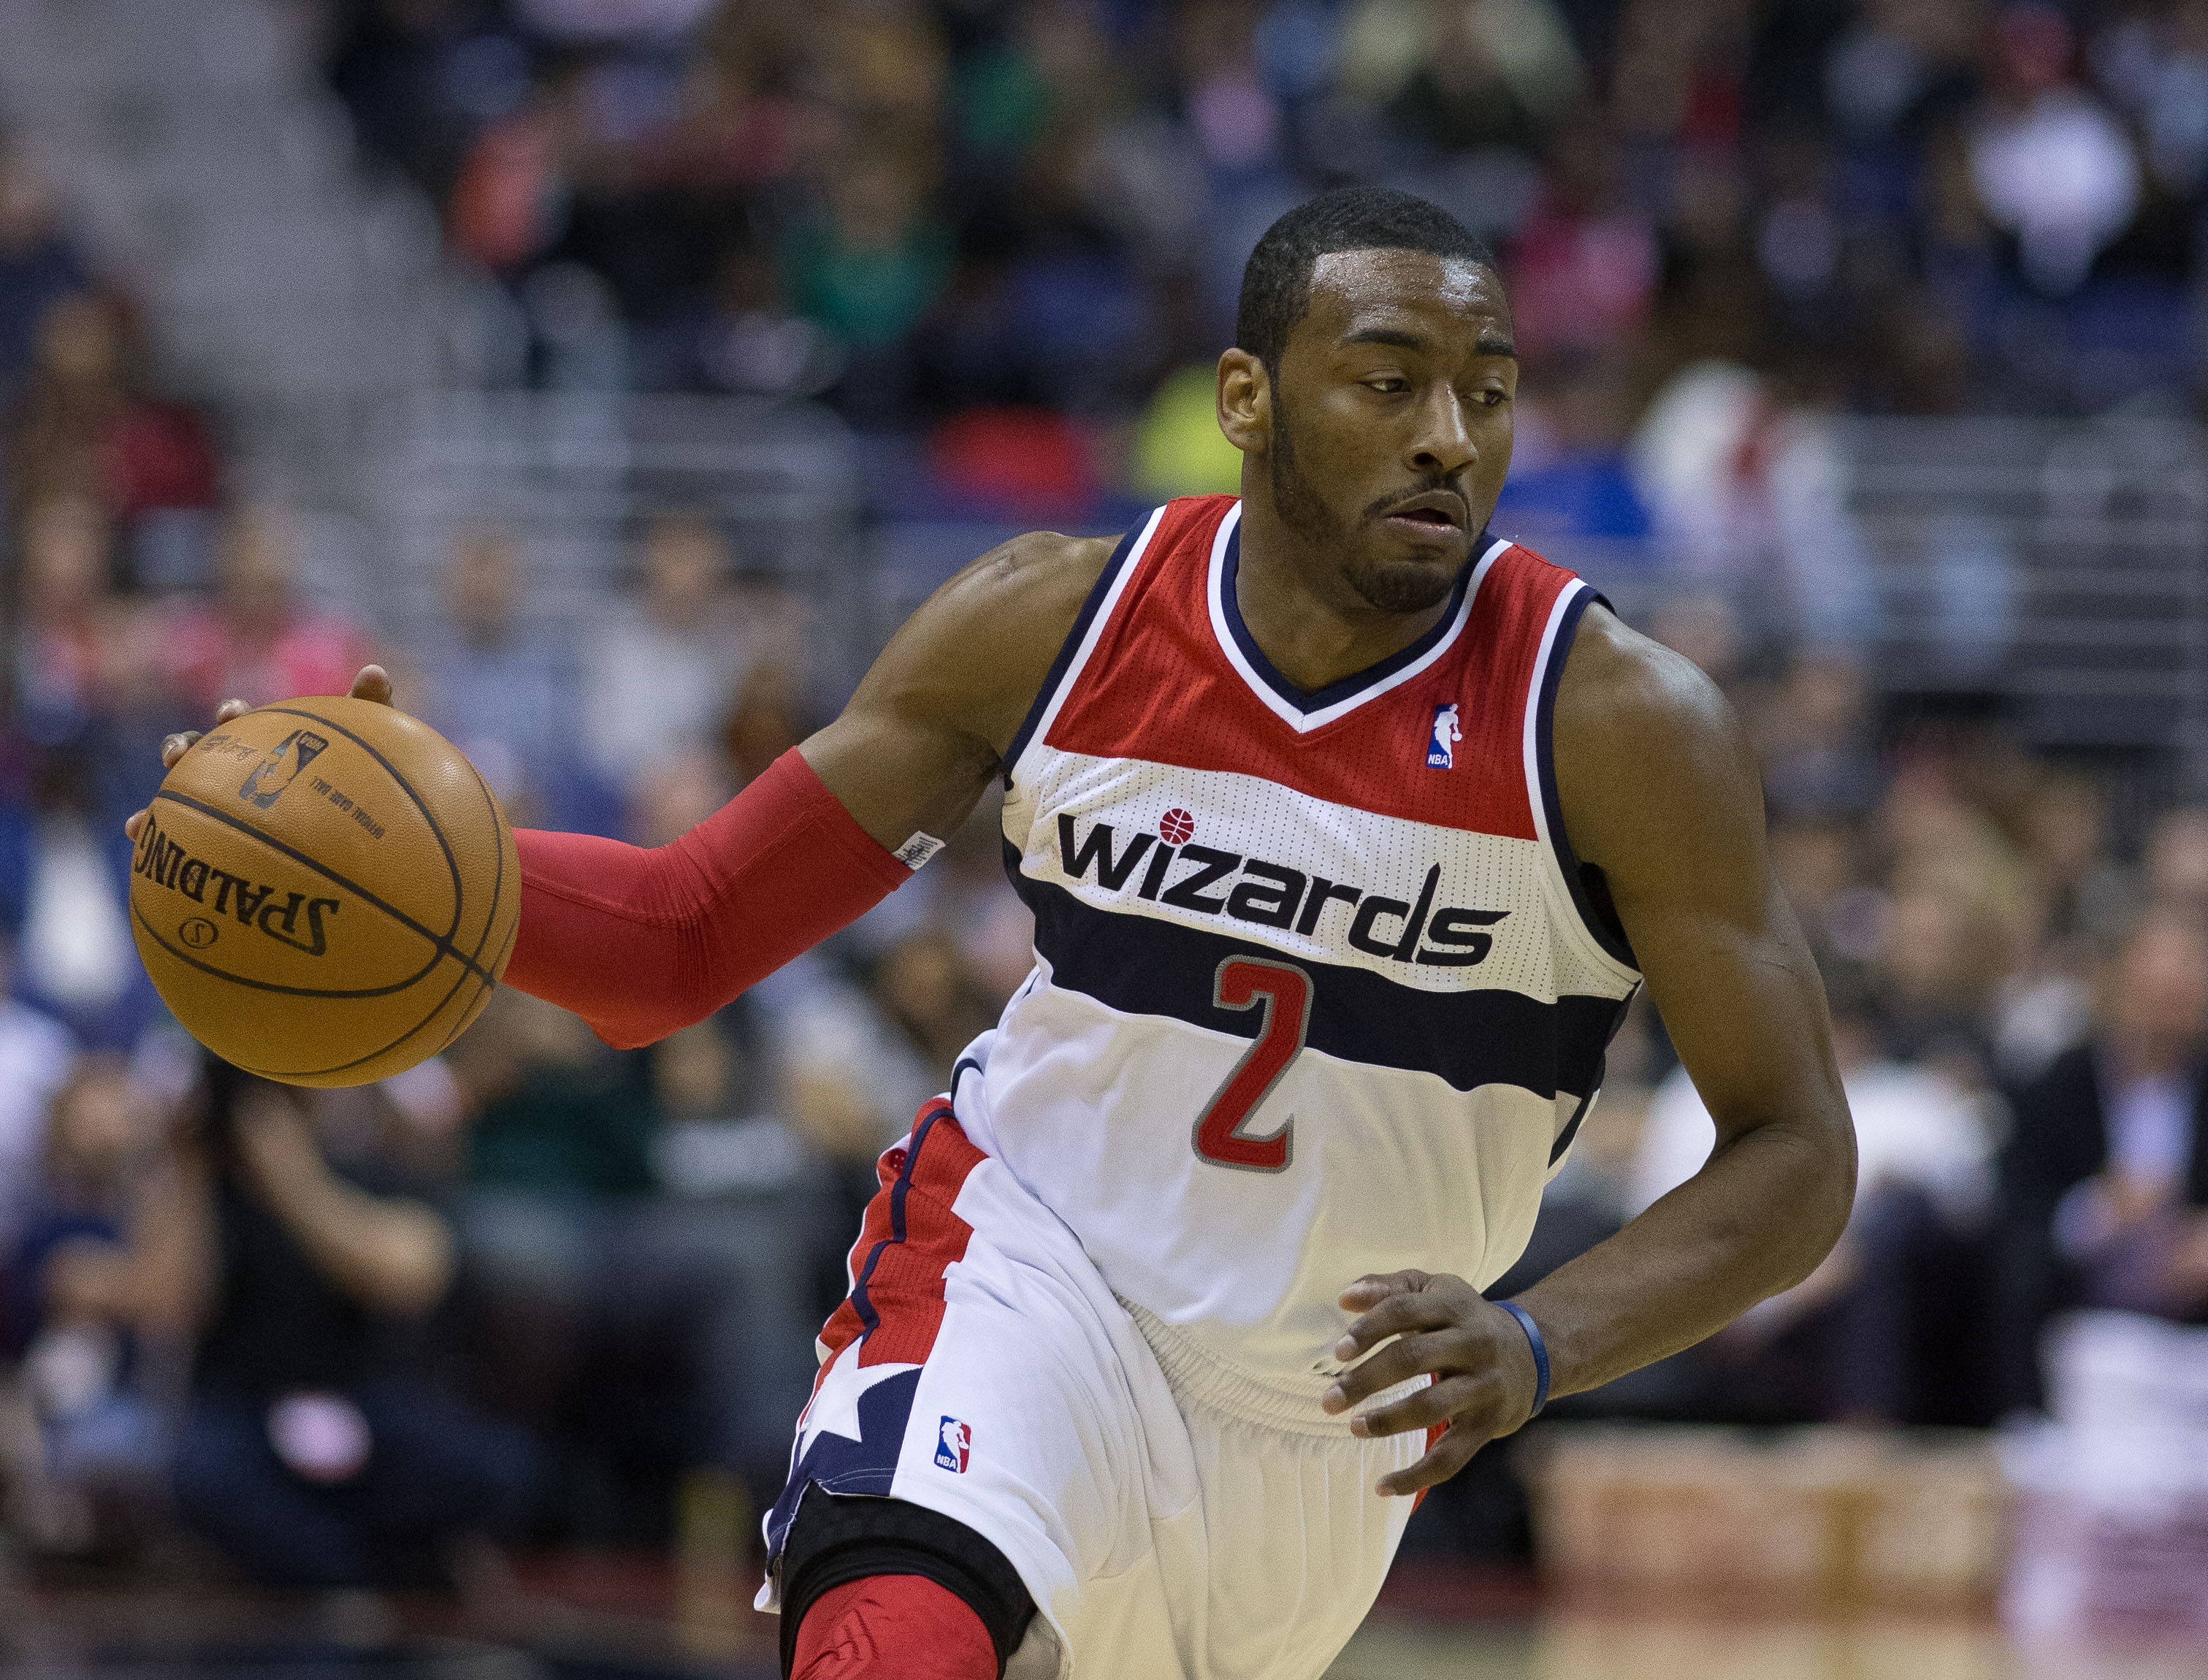
  • No Elite Producers — No, not even Wall, at least not on a per minute basis. His PPA (see below) is 166. That would rank fourth on the Atlanta Hawks behind Al Horford (203), Jeff Teague (190), and Paul Millsap (175). Among players with at least 500 minutes this season, Wall ranks 30th in per minute production. He’s 11th in total production, so I’ll take that as an argument in favor of “elite” status, even though he’s played the second most minutes in the league this year, and seven of the 10 ahead of him have played significantly fewer minutes. Wall IS playing well. But, I think there’s still major room for improvement.
  • Kevin Seraphin — He was better in January, but seems to have flattened out in February. Overall, he continues to rate right around replacement level. I think the team can get by with him against bad teams, but will need better play off the bench when they face tougher competition.
  • Lack of Progress From The Youngsters — Bradley Beal’s PPA has been hovering in the average range; Porter’s in the below-average-but-still-useful range. But, neither guy has taken a significant step forward, and now Beal is sidelined for a third time with a “stress reaction” in his leg.
  • Health — Beal with the stress reaction. Webster recovering from back surgery. Wall with the migraines and the (maybe) Achilles soreness, and/or ankle soreness. Humphries with the back. Nothing major yet, but these bumps and bruises can affect productivity, and there are always injury concerns with older players.

Weekly Player Production Average Update

Player Production Average (PPA) is an overall rating stat I developed that credits players for things they do that help a team win and debits them for things that hurt the cause. PPA is pace neutral, accounts for defense, and includes a “degree of difficulty” factor based on the level of competition a player faces while on the floor. In PPA, 100 = average, higher is better and replacement level is 45.

The numbers under each date represent the player’s PPA for the entire season to that date. The number in the far right column (labeled PPA) is the player’s current PPA through games played last night. For a look at how players on other teams rate, visit here.

2015-02-12 -- Wizards PPA update

My apologies on the format, but I was running out of space for the full week-by-week PPA table. By the end of the season, we’ll all need a magnifying glass to read it.

A lot of consistency at this point. Most of the guys seem to have found their levels. My biggest worries are with the old guys, who seem to be wearing down as the season progresses. Hopefully they’ll be rejuvenated by this year’s extra-long All-Star break.

Wizards Update: The Losing Streak

gortat shaved mohawk

So little time today, but I want to get the numbers up and address one topic: the (apparently) Official Wizards Fan Talking Point that the the Wizards are a “good” team going through a tough stretch.

While there’s a certain appeal to that position, and its supporters could point to the team’s record as evidence, the numbers simply don’t agree. The key stat to understand relative team strength is scoring differential — even more than record. The guys at Basketball-Reference created a robust team strength measure they call Simple Rating System (SRS), which combines scoring differential and strength of schedule.

In SRS, the WIzards have bounced around a bit this season, climbing into the top 10 for a week early on, but steadily sliding since then. Now emerging from the toughest part of their schedule, Washington ranks 16th in SRS — now behind Milwaukee. Consider that the Bucks and Wizards have played schedules of identical difficulty (0.63 points per game worse than average), but the Bucks have outscored their opponents by 1.96 points per game — the Wizards 1.66. A small difference to be sure, but it’s meaningful over the course of the marathon NBA season.

The data says that Washington isn’t a bad team, but it’s not good either. It’s a little better than average with a record made superficially better by the woeful state of the Eastern Conference. Because of the weak conference, the Wizards still have a decent shot at a top three seed, and a reasonable chance of advancing past the first round.

But, the problem isn’t that they’ve “just gotten out of sync” or that they’re not playing hard enough. It’s that they’re just not that good. Their margin for success each night is slender, and on nights when they’re not playing at something close to their best, they’re vulnerable.

Weekly Player Production Average Update

Player Production Average (PPA) is an overall rating stat I developed that credits players for things they do that help a team win and debits them for things that hurt the cause. PPA is pace neutral, accounts for defense, and includes a “degree of difficulty” factor based on the level of competition a player faces while on the floor. In PPA, 100 = average, higher is better and replacement level is 45.

The numbers under each date represent the player’s PPA for the entire season to that date. The number in the far right column (labeled PPA) is the player’s current PPA through games played last night. For a look at how players on other teams rate, visit here.

PLAYER GMS MPG 11/10 11/18 11/24 12/3 12/8 12/17 12/23 12/29 1/6 1/14 1/23 PPA
John Wall 50 35.9 185 180 180 168 167 175 171 171 167 172 167 168
Marcin Gortat 50 29.5 181 186 170 175 179 178 178 173 158 157 160 144
Paul Pierce 47 26.9 140 138 165 134 134 154 142 143 148 144 141 138
Nene Hilario 42 25.5 108 102 68 67 83 94 96 97 101 112 124 109
Bradley Beal 41 34.0 122 63 69 94 90 98 102 106 108 101
Kris Humphries 49 22.0 46 87 90 82 109 100 88 109 103 98 101 110
Rasual Butler 46 20.8 60 131 116 128 155 140 134 123 99 101 89 77
Andre Miller 48 12.2 72 69 92 103 102 101 89 85 97 94 84 81
Otto Porter 45 18.0 97 106 101 95 84 81 84 82 85 82 78 72
Garrett Temple 38 11.7 121 112 96 100 98 91 90 75 73 68 78 74
Kevin Seraphin 49 15.6 38 13 17 12 28 34 45 36 35 44 48 47
Drew Gooden 23 12.0 42 40 59 78 64 47 47 44 32 22 23 29
DeJuan Blair 14 4.6 -41 -40 -40 -74 -56 -47 -46 -34 2 16 19 19
Martell Webster 13 10.0 -150 -44 -67 3
Glen Rice 5 8.6 -120 -117 -117 -117 -114 -113 -111 -111 -110 -110 -110 -109

No big surprises here. As would be expected for a team in a four-game losing streak, production has dipped for several players. Biggest decliners: the old guys — Gortat, Nenê, and Butler. The only real “improver” was Humphries. For the Seraphin watchers, the big fella stabilized right around replacement level since the last update.

Wizards Update: Just the Stats

wall3

Tight schedule this week, so not much commentary. A few brief thoughts:

  • Congratulations to John Wall for receiving a well-deserved spot in his second All-Star game. Many more to come for the Wizards PG.
  • Hearkening back to last week’s piece, in which I compared this year’s Wizards to teams in NBA history with a similar SRS (stands for Simple Rating System — it’s a measure of team strength that combines scoring margin with strength of schedule), there’s this: In NBA history (including this year to-date), 247 teams have had a winning percentage of 65% or better. (The Wizards are currently at .674.) Where does Washington’s squad this year stand on that list in SRS? 247th.
  • During a game this week, CSN threw onto the screen one of its pointless, irrelevant and cherrypicked “stats.” In this case, it was something about Kevin Seraphin being among the league leaders in 4th quarter FGs. The information was correct, but without meaning. Seraphin is among the league leaders in 4th quarter minutes played, 4th quarter turnovers and 4th quarter fouls. He’s played more than twice as many 4th quarter minutes as Marcin Gortat. When I checked, he had one fewer 4th quarter rebounds than Damian Lillard. Seraphin’s 4th quarter PPA: an anemic 59. And oh yeah, the Wizards have been outscored by 53 points (9.0 points per 48 minutes) during Seraphin’s time on the floor during the 4th quarter.

Weekly Player Production Average Update

Player Production Average (PPA) is an overall rating stat I developed that credits players for things they do that help a team win and debits them for things that hurt the cause. PPA is pace neutral, accounts for defense, and includes a “degree of difficulty” factor based on the level of competition a player faces while on the floor. In PPA, 100 = average, higher is better and replacement level is 45.

PLAYER GMS MPG 11/10 11/18 11/24 12/3 12/8 12/17 12/23 12/29 1/6 1/14 PPA
John Wall 43 35.5 185 180 180 168 167 175 171 171 167 172 167
Marcin Gortat 43 29.6 181 186 170 175 179 178 178 173 158 157 160
Paul Pierce 41 26.7 140 138 165 134 134 154 142 143 148 144 141
Nene Hilario 36 24.8 108 102 68 67 83 94 96 97 101 112 124
Bradley Beal 34 33.4 122 63 69 94 90 98 102 106 108
Kris Humphries 42 21.3 46 87 90 82 109 100 88 109 103 98 101
Rasual Butler 39 22.5 60 131 116 128 155 140 134 123 99 101 89
Andre Miller 43 12.6 72 69 92 103 102 101 89 85 97 94 84
Otto Porter 39 18.0 97 106 101 95 84 81 84 82 85 82 78
Garrett Temple 32 11.9 121 112 96 100 98 91 90 75 73 68 78
Kevin Seraphin 42 15.6 38 13 17 12 28 34 45 36 35 44 48
Drew Gooden 22 11.9 42 40 59 78 64 47 47 44 32 22 23
DeJuan Blair 14 4.6 -41 -40 -40 -74 -56 -47 -46 -34 2 16 19
Martell Webster 8 9.8 -150 -44 -67
Glen Rice 5 8.6 -120 -117 -117 -117 -114 -113 -111 -111 -110 -110 -110

Largely a status quo update. Wall and Pierce were down a little, but Gortat, Nenê and Beal were up. Rasual Butler and Andre Miller had rough weeks. Seraphin’s production rate crept past replacement level.

Wizards Update: Just How Good Are They?

wall calls play

The Wizards continue to rack up wins — even over the last 10 games, which has been the team’s most challenging stretch of the year. Last night, they did something that has me typing words that would have been difficult to imagine typing just last season: Fueled by a strong performance from Kevin Seraphin, Washington blew open a close contest late to secure a comfortable win against the San Antonio Spurs.

It was the team’s first win over the Spurs since 2005. The team’s record now sits at 26-12, good for second in their division and in the conference. Their .684 winning percentage is that of a 56-win team over an 82-game schedule — rarefied air for this franchise.

But…are they really that good? Basketball analytics has shown that scoring differential is a better predictor of team strength than its record. Luck can push a team’s record up or down a few wins, but how much it outscores its opponents offers a truer measure of relative strength.

So far this season, Washington’s scoring differential is +2.13, a mark that would suggest a 47-win team. Add in their weak schedule (fifth easiest in the league), and their differential falls to +1.49, which would suggest a 45-win team.

That +1.49 is Basketball-Reference’s Simple Rating System, a strength rating that combines scoring differential with strength of schedule. Of teams in NBA history with a similar SRS (between +1.0 and +2.0), the Wizards have the best winning percentage. They’re at .684 so far. Next closest is the 1961-62 Lakers at .675.

Of the 115 teams in that similar SRS grouping, the average winning percentage is .554 — so, 45 wins.

Narrow the focus to an SRS between +1.4 and +1.6, and the field is cut to 17 teams. And the winning percentage drops to .541 — about 44 wins.

But, here’s where that strength of schedule thing works in Washington’s favor. While the Wizards aren’t overwhelmingly strong, the East remains historically weak. Their schedule the rest of the way is about 0.7 points per game weaker than average — roughly the quality of a 39-win team the rest of the way. Because of that, Washington projects to finish with 51-53 wins, even without improving their scoring differential.

Weekly Player Production Average Update

Player Production Average (PPA) is an overall rating stat I developed that credits players for things they do that help a team win and debits them for things that hurt the cause. PPA is pace neutral, accounts for defense, and includes a “degree of difficulty” factor based on the level of competition a player faces while on the floor. In PPA, 100 = average, higher is better and replacement level is 45.

PLAYER GMS MPG 11/10 11/18 11/24 12/3 12/8 12/17 12/23 12/29 1/6 PPA
John Wall 38 35.5 185 180 180 168 167 175 171 171 167 172
Marcin Gortat 38 29.5 181 186 170 175 179 178 178 173 158 157
Paul Pierce 36 26.4 140 138 165 134 134 154 142 143 148 144
Nene Hilario 31 24.5 108 102 68 67 83 94 96 97 101 112
Bradley Beal 29 33.4 122 63 69 94 90 98 102 106
Rasual Butler 34 22.7 60 131 116 128 155 140 134 123 99 101
Kris Humphries 37 21.5 46 87 90 82 109 100 88 109 103 98
Andre Miller 38 12.6 72 69 92 103 102 101 89 85 97 94
Otto Porter 28 18.2 97 106 101 95 84 81 84 82 85 82
Garrett Temple 29 12.8 121 112 96 100 98 91 90 75 73 68
Kevin Seraphin 37 15.6 38 13 17 12 28 34 45 36 35 44
Drew Gooden 21 12.2 42 40 59 78 64 47 47 44 32 22
DeJuan Blair 12 4.8 -41 -40 -40 -74 -56 -47 -46 -34 2 16
Martell Webster 5 11.6 -150 -44
Glen Rice 5 8.6 -120 -117 -117 -117 -114 -113 -111 -111 -110 -110

It was fun to see Seraphin follow a good performance against the Hawks with an outstanding one against the Spurs. But, it’s going to take a sustained run of solid play from the big fella to convince me he belongs in the rotation. Previous analysis of Seraphin’s game log showed he has an above average game about 20% of the time. Over the course of an 82-game schedule, it’s almost inevitable that he’d have at least one two-game sequence where he performs above average in each. There’s approximately a 47% chance he’ll have a three-game sequence in which he performs above average.

In fact, he’s already done it this season against Denver, at Boston and home against Boston from December 5-8. He followed up that three-game stretch with a meh game at Orlando, two negative games against the Clippers and Jazz, and then a replacement level performance against Minnesota. If you want a sign that he’s truly improved, wait until he’s strong together four or more consecutive above average performances.

Also good: upticks in performance from Wall, Nenê, and Beal. Gortat’s performance was flat, but significantly down his production in December.

There seems to be some sentiment among Wizards fans (and maybe even the coach) that the team needs a backup PG to replace or supplement Miller. While Miller is a defensive liability, his overall performance (which is what matters) has been solid.

If the team is looking to upgrade for the second half of the season, it wouldn’t hurt to add a third PG for insurance. But, more pressing issues are Seraphin as the backup center, and perhaps a more athletic 3&D type to backup Beal.

Wizards Update: Successful Trip, But Concerns Remain

While fans worried during Washington’s three-game losing streak over the past week, the Wizards completed a successful road trip against Western Conference opponents with wins over Houston and New Orleans. Entering the trip as decided underdogs in all five contests, the Wizards were competitive in all but the Dallas game — which came the night after a gritty win against the Rockets.

Upon completion of the trip, I updated my “who’s gonna win” calculator and projected the Wizards’ final record. At the Washington Post this week, columnist Thomas Boswell did a nice job explaining why the Wizards aren’t as good as their record. Everything Boswell wrote is valid and correct, but…being in the Eastern Conference this season is incredibly fortunate for a middle-of-the-pack team like the Wizards.

Based on season performance through last night’s games, I estimate Washington will finish with 51-54 wins — the best season for the franchise since the mid-1970s.

My biggest concerns for the Wizards going forward are these:

  • Age — Many seem to think this is a young team, but it’s not. They have the league’s 7th oldest rotation, and they’re reliant on 30+ year olds in key roles — including the 38-year old Andre Miller and the 37-year old Paul Pierce. And there’s Nenê, whose play has declined the past couple years as he’s suffered through a series of nagging injuries.
  • No elite producers — I can hear the screens breaking all over the DC area. What about John Wall?! He’s an All-Star, a top five PG, and you wrote last week that he’s the league’s best defensive PG. Well, some of that is true. But, good as Wall has been this season, he’s still well behind the game’s elite players when it comes to doing things that cause a team to win. As I’ve pointed out previously, Wall does a lot of good things when he’s on the floor, but…he also does a lot of things that hurt — specifically turnovers, missed shots and poor shot selection. To become an elite team, the Wizards need him to play even better than he already has.
  • Kevin Seraphin — The coaches keep playing him, and in games against weaker opponents he doesn’t hurt too much. Against better teams, it hurts to have Seraphin in the lineup. That was apparent in the loss against Oklahoma City. In a game the Wizards lost by seven, they were -11 when Seraphin was on the floor. For those who don’t want to do the math, that means Washington was +7 when he was on the bench.
  • Lack of Progress from the youngsters — I’m a big fan of Bradley Beal and Otto Porter, but both guys have been pretty average so far. Beal’s 102 PPA (see below) is a modest improvement, but is below average for a starter (125). Porter has been okay as a backup, and is performing at a level similar to that of players with similar collegiate production. Neither guy has demonstrated they should be considered foundational players for the Wizards. And, I think Washington will need one of the two (preferably Beal) to make that leap this season if they hope to reach the conference Finals…or more.
  • Coaching — Encouraged by head coach Randy Wittman, the Wizards continue to take too many two-point jumpers. Sometimes they’re necessary, but the math is abundantly clear that they’re bad shots — exactly the ones the defense wants them to take.

Weekly Player Production Average Update

Player Production Average (PPA) is an overall rating stat I developed that credits players for things they do that help a team win and debits them for things that hurt the cause. PPA is pace neutral, accounts for defense, and includes a “degree of difficulty” factor based on the level of competition a player faces while on the floor. In PPA, 100 = average, higher is better and replacement level is 45.

PLAYER GMS MPG 11/10 11/18 11/24 12/03 12/08 12/17 12/23 12/29 PPA
John Wall 29 35.6 185 180 180 168 167 175 171 171 167
Marcin Gortat 29 29.6 181 186 170 175 179 178 178 173 158
Paul Pierce 28 26.4 140 138 165 134 134 154 142 143 148
Kris Humphries 28 21.7 46 87 90 82 109 100 88 109 103
Bradley Beal 20 33.2 122 63 69 94 90 98 102
Nene Hilario 22 24.2 108 102 68 67 83 94 96 97 101
Rasual Butler 25 22.6 60 131 116 128 155 140 134 123 99
Andre Miller 29 12.8 72 69 92 103 102 101 89 85 97
Otto Porter 28 18.7 97 106 101 95 84 81 84 82 85
Garrett Temple 25 14.0 121 112 96 100 98 91 90 75 73
Kevin Seraphin 28 15.4 38 13 17 12 28 34 45 36 35
Drew Gooden 18 13.1 42 40 59 78 64 47 47 44 32
DeJuan Blair 9 5.0 -41 -40 -40 -74 -56 -47 -46 -34 2
Glen Rice 5 8.6 -120 -117 -117 -117 -114 -113 -111 -111 -110
Martell Webster 2 10.0 -150

No major surprises considering the team went 2-3 over the past week. Wall took over the top spot in the team’s PPA rankings because Gortat’s play dropped further.

Rasual Butler’s anticipated reversion to the mean is in progress. Hopefully, Beal’s play will improve as Butler’s dips.

Seraphin held steady…below replacement level.

For the first time in weeks, the Wizards dusted off DeJuan Blair, and he moved his PPA out of negative territory.

Martell Webster looked terrible in his return from back surgery.

Wizards Update: About to Be Tested

At 21-8, the Wizards are off to the second best start in franchise history. Check out the very bottom of the table in that link and note that Washington had its worst start in franchise history just two seasons ago. The front office’s strategic shift to proven veterans combined with a historically weak Eastern Conference to bring about an abrupt about-face in the team’s record.

While the Wizards have enjoyed the league’s easiest schedule so far, things are about to change. To this point in the season, Washington’s opponents have been 1.32 points per game worse than average. Over the next 19 games, their competition will be about a point per game better than average.

To say it another way, Washington’s average opponent so far this season has been the equivalent of a 37-win team — a lottery squad in either conference most years. Over the next quarter of the season, their opponents will be the quality of a 44-win team — a near-lock for the playoffs in either conference.

The next five games will likely be the toughest stretch of the regular season. Over the next week, Washington has road games against Houston, Dallas, Oklahoma City, San Antonio and New Orleans — and the schedule includes two sets of back-to-back contests.

The Wizards will be underdogs in all five games, and their average competition this week will be equivalent to a 50-win squad. It won’t be easy.

I ran the numbers in my “who’s gonna win?” machine. The machine projects Washington to go 9-10 over the next month, including a five-game skid starting tonight. This will likely test the faith of Wizards fans, but I think reality for Washington is that they’re a solid team in a weak conference.

Based on how teams have performed to this point in the season, The Machine predicts Washington will go 33-20 over their remaining games to finish the year 54-28. This would be tied with the 1978-79 Bullets for the third best mark in franchise history. Fans my age might recall that the 78-79 team went to the NBA Finals where they lost to Seattle. I suspect fans of any age would be ecstatic if this year’s team reached the Finals and got thumped by a top-shelf Western Conference opponent.

Weekly Player Production Average Update

Player Production Average (PPA) is an overall rating stat I developed that credits players for things they do that help a team win and debits them for things that hurt the cause. PPA is pace neutral, accounts for defense, and includes a “degree of difficulty” factor based on the level of competition a player faces while on the floor. In PPA, 100 = average, higher is better and replacement level is 45.

PLAYER GMS MPG 10-Nov 18-Nov 24-Nov 3-Dec 8-Dec 17-Dec 23-Dec PPA
Marcin Gortat 29 29.7 181 186 170 175 179 178 178 173
John Wall 29 35.8 185 180 180 168 167 175 171 171
Paul Pierce 28 27.0 140 138 165 134 134 154 142 143
Rasual Butler 25 22.8 60 131 116 128 155 140 134 123
Kris Humphries 28 21.9 46 87 90 82 109 100 88 109
Bradley Beal 20 33.0 122 63 69 94 90 98
Nene Hilario 22 24.2 108 102 68 67 83 94 96 97
Andre Miller 29 12.4 72 69 92 103 102 101 89 85
Otto Porter 28 19.0 97 106 101 95 84 81 84 82
Garrett Temple 25 14.4 121 112 96 100 98 91 90 75
Drew Gooden 18 13.3 42 40 59 78 64 47 47 44
Kevin Seraphin 28 15.3 38 13 17 12 28 34 45 36
DeJuan Blair 9 4.6 -41 -40 -40 -74 -56 -47 -46 -34
Glen Rice 5 8.6 -120 -117 -117 -117 -114 -113 -111 -111

Plenty of stability in this update as several players seem to have established their performance levels.

Humphries went back into “above average” territory with two outstanding games off the bench this week.

Butler’s production seems to be coming back to earth after preposterously torrid shooting for the first 20 games of the season. Hopefully, whatever’s lost from his return to norms will be offset by improvement from Beal.

After improving his PPA in three consecutive updates, Seraphin spent the past week Seraphining. Over his past three games, Seraphin played 40 minutes. During those minutes on the floor, he scored 20 points (yay points!) while getting three rebounds, one assist, no steals or blocks, but four turnovers and seven fouls.

He did shoot 10-20 over those three games, but he got to the free throw line just once (he missed). His 50% shooting isn’t bad — league average efg is .499. But, add in the turnovers, the lack of offensive rebounds and the inability to get to the free throw line, and his offensive rating (points produced per individual possession x 100) was just 81 — 25 points below league average, and nearly 27 points below the Wizards’ average over the past three games.

With the schedule getting tougher, it’s time for the Seraphin experiment to end.

Wizards Update: Best Start In Franchise History

These are strange and enjoyable days for Wizards fans. The team is 19-7, tied for the best start in franchise history, and metaphysically certain to make another trip to the playoffs. They’re in a tight race with the Atlanta Hawks for first in the Southeast Division. And John Wall is probably going to make his second All-Star game appearance in February.

The team is fairly deep in terms of solid players, though Wall and Pierce (the team’s top producers) still fall short of the game’s elite. The Wizards have benefited so far from playing the league’s easiest schedule. That’ll change somewhat when they make their trips to the West, but they’re in the Eastern Conference so their competition isn’t going to get much more challenging.

That said, the Wizards have no control over the schedule or the state of other teams. Their job is to beat whoever’s in the other color jersey, and they’re doing a good job of that so far this season.

Weekly Player Production Average Update

Player Production Average (PPA) is an overall rating stat I developed that credits players for things they do that help a team win and debits them for things that hurt the cause. PPA is pace neutral, accounts for defense, and includes a “degree of difficulty” factor based on the level of competition a player faces while on the floor. In PPA, 100 = average, higher is better and replacement level is 45.

PLAYER GMS MPG 10-Nov 18-Nov 24-Nov 3-Dec 8-Dec 17-Dec PPA
Marcin Gortat 26 29.5 181 186 170 175 179 178 178
John Wall 26 36.1 185 180 180 168 167 175 171
Paul Pierce 25 27.4 140 138 165 134 134 154 142
Rasual Butler 22 22.3 60 131 116 128 155 140 134
Nene Hilario 19 24.6 108 102 68 67 83 94 96
Bradley Beal 23 32.9 122 63 69 94 90
Garrett Temple 17 15.6 121 112 96 100 98 91 90
Andre Miller 26 12.2 72 69 92 103 102 101 89
Kris Humphries 25 21.5 46 87 90 82 109 100 88
Otto Porter 25 19.6 97 106 101 95 84 81 84
Drew Gooden 16 14.8 42 40 59 78 64 47 47
Kevin Seraphin 25 15.6 38 13 17 12 28 34 45
DeJuan Blair 8 4.6 -41 -40 -40 -74 -56 -47 -46
Glen Rice 5 8.6 -120 -117 -117 -117 -114 -113 -111

Production rates are stabilizing for many on the team. This week, most of the ratings edged down slightly — that was the case for Wall, Pierce, Butler, Beal, Miller, Temple, and Humphries. Nenê and Porter edged up a bit.

The biggest improver was Kevin Seraphin, whose rating for the season rose to replacement level.

Wizards Update: Is Wall A Top 5 PG?

Now in his fifth year, Wizards PG John Wall is having the best season of his career. He’s drawn accolades from observers around the league, and some Washington fans have even started wondering if he might be a fringe MVP candidate. The MVP talk and the “he’s the best PG in the league” assertions are premature, however. He’s terrifically productive, but there’s still room for significant improvement.

Put away the pitchforks and torches. While Wall isn’t quite where fans want to place him, this is really good news for the Wizards. He’s a phenomenal player whose best days are likely still in the future.

While Wall’s passing and offensive creativity elicits praise, his greatest contribution is on the defensive end. In the defense part of my metric (Player Production Average — PPA for short), Wall rates as the league’s best defensive PG. That’s not a typo. Number one. Top of the heap. Nobody better. That finding is echoed by ESPN’s Real Plus Minus stat. If the season ended today, he’d be on my first-team All-Defense ballot.

As head coach Randy Wittman told the Sports Junkies this morning, Wall has all the attributes of an outstanding defender — size, quickness, speed, strength, length. And while he’s rated as a good defender in my system in previous years, he’s made the defensive leap this season with suffocating on-ball pressure, hard close-outs on shooters, and impeccable timing in the passing lanes.

The Los Angeles Clippers, led by elite PG Chris Paul, struggled to get into their offensive sets early in Washington’s win last week because of Wall’s pressure. Consider this: Paul has 49 total turnovers this season. Six of them came against the Wizards.

By now you’re probably wondering: If Wall’s so great on defense and he’s such a great passer and the Wizards are winning, why don’t you agree he’s an MVP candidate? Why are you about to tell me he’s not a top five PG?

Which brings me back to a junk metric I created last season: Only Good Stuff. In its simplest form, OGS is points + rebounds + assists + steals + blocks.

Wall is among the game’s more active players when he’s out there. He produces lots of OGS — 7th most in the league, in fact. Here’s the top 10 in OGS:

  1. James Harden — 977
  2. Anthony Davis — 940
  3. Stephen Curry — 922
  4. Kobe Bryant — 917
  5. Lebron James — 917
  6. LaMarcus Aldridge — 869
  7. John Wall — 867
  8. Blake Griffin — 843
  9. Kyle Lowry — 361
  10. Damian Lillard — 835

That’s a pretty impressive group, and Wall sits second among PGs. But, it’s ONLY the good stuff. What if we look at the other side of the ledger — Only Bad Stuff (missed field goal attempts + 0.5 x missed free throw attempts + turnovers + fouls)? Well, Wall’s near the top of that list too — 6th most OBS. The bottom 10:

  1. Kobe Bryant — 502
  2. James Harden — 422
  3. Monta Ellis — 389
  4. Josh Smith — 387
  5. Carmelo Anthony — 384
  6. John Wall — 367
  7. Tyreke Evans — 365
  8. Kyle Lowry — 361
  9. Blake Griffin — 360
  10. Stephen Curry — 351

So, with Wall (and several other of the game’s outstanding players), lots of good AND lots of “bad.” What if we combine the two? Because the categories aren’t weighted based on how much they contribute to winning, let’s call this last category Unweighted Total Stuff (UTS) — OGS – OBS. Here’s the top 10:

  1. Anthony Davis — 687
  2. Stephen Curry — 571
  3. Lebron James — 559
  4. James Harden — 555
  5. Chris Paul — 523
  6. LaMarcus Aldridge — 523
  7. Marc Gasol — 512
  8. Tyson Chandler — 505
  9. John Wall & Damian Lillard — 501
  10. Blake Griffin — 484

Enough with the “stuff,” according to PPA (which is pace neutral, accounts for defense, and includes a degree of difficulty factor), Wall currently sits 8th among PGs on a per minute basis. Westbrook, Curry and Paul are clearly the top three. Lillard is next. Then it’s a tight group of Jeff Teague, Lowry, Mike Conley and Wall.

The scores of Wall’s group are close enough that I’d classify them as “about the same” and reasonable minds can differ on what order they should be in. I won’t argue if you want to push Wall to fifth, though I don’t see justification for ranking him higher at this point.

As mentioned above, Wall rates as the best defender — Lowry and Conley rate as average; Teague as a good-not-outstanding defender. However, Wall is the least efficient on offense among the top PGs by approximately 8 points per 100 possessions.

In TOTAL production, Wall currently sits 5th behind Curry, Paul, Lillard and Lowry. Kyrie Irving slips in ahead of Wall for fifth in per game PPA.

What can Wall do to improve? Shoot better and commit fewer turnovers.

How good has Wall been in December? His PPA for the month is 219 so far. If that was his PPA for the season, he’d rank 4th among PGs, ahead of Lillard, but still behind Westbrook, Curry and Paul.

To this week’s PPA update…

PPA is an overall rating stat I developed that credits players for things they do that help a team win and debits them for things that hurt the cause. PPA is pace neutral, accounts for defense, and includes a “degree of difficulty” factor based on the level of competition a player faces while on the floor. In PPA, 100 = average, higher is better and replacement level is 45.

PLAYER GMS MPG 10-Nov 18-Nov 24-Nov 3-Dec 8-Dec PPA
Marcin Gortat 19 30.2 181 186 170 175 179 178
John Wall 19 35.9 185 180 180 168 167 175
Paul Pierce 19 27.3 140 138 165 134 134 154
Rasual Butler 15 21.6 60 131 116 128 155 140
Andre Miller 19 12.4 72 69 92 103 102 101
Kris Humphries 18 22.0 46 87 90 82 109 100
Nene Hilario 13 33.2 108 102 68 67 83 94
Bradley Beal 10 24.6 122 63 69 94
Garrett Temple 17 17.0 121 112 96 100 98 91
Otto Porter 18 20.1 97 106 101 95 84 81
Drew Gooden 12 15.9 42 40 59 78 64 47
Kevin Seraphin 18 15.3 38 13 17 12 28 34
DeJuan Blair 6 4.6 -41 -40 -40 -74 -56 -47
Glen Rice 5 8.6 -120 -117 -117 -117 -114 -113

The Paul Pierce signing looks better and better. The last time Pierce was this productive was the 2011-12 season. His efficiency numbers have surged as the SF has found the Fountain of Youth. One potential warning sign is a slip in his defensive impact since the season’s opening weeks. After rating solidly above average earlier in the year, he’s down to average in my most recent update.

Andre Miller is another of the Wizards ancients who continues to perform well. The team plays dramatically different when he replaces Wall in the lineup (they slow by 10 possessions per 48 minutes), but they’re crazy efficient when he’s out there. It seems like every game is a masterclass for how to get to the rim despite running in slow motion.

Statistical tidbit: so far this season, Wall is averaging 14.8 assists per 100 possessions. Miller is averaging 14.4.

Beal and Nenê increased production after a couple rough weeks. I hope Wittman continues to use Nenê off the bench where he can face opponent reserves when Washington is on offense, and anchor a weak defensive second unit.

Kevin Seraphin was up for a second straight week. His rebounding has improved the past couple weeks, though his offensive efficiency remains poor. Among the team’s regulars, he’s in a virtual tie with Miller as the least effective defender.

Wizards Update: Two Steps Forward, One Step Back

rasual

Over the past week, the Wizards rolled to convincing wins over the hapless Lakers and the not-awful Nuggets, and then lost a shoulda-won game against a middling Celtics squad. And, in the grand tradition of players having good games shortly after I rip them, Kevin Seraphin had probably his best game of the year against Denver.

Meanwhile, John Wall climbed into a tie with Rajon Rondo for having the biggest defensive impact for a point guard in my rating system. Wall shows up in my numbers as having the biggest defensive impact on the Wizards so far this season. Not bad for a guy who I still think has room for improvement on the defensive end.

Other positive defenders: Marcin Gortat, Nenê, Kris Humphries, and Garrett Temple.

The “about average” grouping includes: Otto Porter, Rasual Butler and Paul Pierce. Pierce, had gotten off to an excellent start defensively, but his individual performance seems to have slipped a bit over the past couple weeks.

Bradley Beal and Drew Gooden are in the “bad defensive impact” category so far. Kevin Seraphin and Andre Miller are defensive dumpster fires to this point in the year.

Below is the Player Production Average (PPA) update. PPA is an overall rating stat I developed that credits players for things they do that help a team win and debits them for things that hurt the cause. PPA is per-minute, pace neutral, accounts for defense, and includes a “degree of difficulty” factor based on the level of competition a player faces while on the floor. In PPA, 100 = average, higher is better and replacement level is 45.

PLAYER GMS MPG 10-Nov 18-Nov 24-Nov 3-Dec PPA
Marcin Gortat 19 30.5 181 186 170 175 179
John Wall 19 35.3 185 180 180 168 167
Rasual Butler 15 20.3 60 131 116 128 155
Paul Pierce 19 26.6 140 138 165 134 134
Kris Humphries 18 19.7 46 87 90 82 109
Andre Miller 19 12.6 72 69 92 103 102
Garrett Temple 17 20.2 121 112 96 100 98
Otto Porter 18 21.9 97 106 101 95 84
Nene Hilario 13 25.5 108 102 68 67 83
Bradley Beal 10 30.4 122 63 69
Drew Gooden 12 17.3 42 40 59 78 64
Kevin Seraphin 18 15.2 38 13 17 12 28
DeJuan Blair 6 5.7 -41 -40 -40 -74 -56
Glen Rice 5 8.6 -120 -117 -117 -117 -114

The first thing I wondered about when perusing the table above was the lack of change in Wall’s PPA. My feeling was that he had a terrific week. But, the game log shows that he shoot poorly (efg of just .395) and that he committed 14 turnovers.

Rasual Butler had another week of outlandishly good shooting. In non-shooting categories, Butler’s numbers are all within established career norms. So far in Washington, he’s shooting .579 from 2pt range (vs. a career average of .435), and .545 from 3pt range (vs. a career average of .364).

I know fans want to attribute this to The Wall Effect, but a) only about half Butler’s minutes have been with Wall; b) he’s shooting with outlandish accuracy (and more often) when Wall’s on the bench; and c) his shooting numbers in Indiana last season were also significantly better than his previous career norms.

Butler efg usg
with Wall .765 13.8%
w/o Wall .700 20.3%

It may simply be that Butler worked hard and improved his shooting late in his career. And, it may be that he’s ripe for a regression. Sample sizes are still small: just 304 minutes and 112 shot attempts so far this season.

I’d like to see the Wizards continue to start Humprhies and bring Nenê off the bench. The starting lineup doesn’t appear to have suffered with the change, which isn’t surprising considering how little Nenê was producing. I suspect Nenê’s production will improve going against bench bigs. And, bringing him off the bench, gives the coaching staff options at PF and C, which means they can drop Seraphin from the rotation.

Despite the loss to Boston, the week was a positive one for the Wizards. Good teams win games convincingly. They don’t necessarily have the best record in close games, because they often avoid close games in the first place. That Washington won three in a row (including the win against Miami) by double digits may be a marker of the team getting stronger.

Wizards Update: Rolling in the East

It’s good to be a Wizards fan right now. The team is 9-3, and reasonable forecasts suggest they’re probably the second best team in their conference. That the conference is historically weak isn’t their fault. The front office put together a solid, veteran squad, and the rest of the conference backed up.

So far this season, the NBA’s collective record vs. Eastern Conference teams is 111-85. That’s a .566 winning percentage, which works out to about 46 wins over an 82-game schedule.

Against the Western Conference, the NBA’s collective record is 86-112, which is a .434 winning percentage. That means about 36 wins over an 82-game schedule.

In other words, we would expect an average team facing the East to win about 46 games…which is what Basketball-Reference forecasts for the Wizards. To highlight the relative power differential between conferences, Basketball Reference predicts the Wizards will finish the season as the second best team in the East, but with an SRS (a robust and “simple” rating system that combines a team’s scoring differential with that of its opponents) that would land it 11th in the West.

But, this is a “moment in time” snapshot. The picture changes a bit with every game played. And there are still a ton of games on the schedule.

Before I get to this week’s stat update, I wanted to address a recurring sentiment I’ve been hearing from an array of Wizards fans. Basically, it’s some variation on the theme that Kevin Seraphin is having a good season or a breakout game or a coming out party or developing into a valuable reserve.

He’s not. At least not so far.

In fact, he’s playing poorly, even compared to his previous performances, which ranked him as the league’s least productive center (per minute) two seasons ago, and the second least productive center last season.

On offense, he’s shooting a good percentage this season, but continues to be a poor passer and a turnover machine. He rates as having very little defensive impact,because of his anemic defensive rebounding and rampant fouling.

The measuring stick on Seraphin is so off that one fan (who later suggested it was the beer talking) tweeted a rave about Seraphin being a revelation on a night the big fella shot 2-7 from the floor.

Here’s Seraphin’s game-by-game PPA scores for this season:

GMS MIN PPA
1 7.7 -202
2 1.9 -1003
3 22.1 184
4 13.9 -84
5 18.1 64
6 19.5 139
7 16.7 -70
8 16.1 -36
9 10.6 -36
10 23.4 83
11 13.1 -29

In PPA, 100 = average and higher is better. In 11 games, Seraphin has managed an above-average production rate twice. He’s been a net negative seven times — six, if you prefer to throw out the two-minute stint in the second game of the season.

I like Seraphin, the person. But, he’s not a good NBA player. He hasn’t become one. He’s showing very few signs of developing into one. The Wizards need to find another option as their backup center.

Below is the Player Production Average (PPA) update. PPA is an overall rating stat I developed that credits players for things they do that help a team win and debits them for things that hurt the cause. PPA is per-minute, pace neutral, accounts for defense, and includes a “degree of difficulty” factor based on the level of competition a player faces while on the floor. In PPA, 100 = average, higher is better and replacement level is 45.

PLAYER GMS MPG 10-Nov 18-Nov PPA
John Wall 12 35.7 185 180 180
Marcin Gortat 12 30.9 181 186 170
Paul Pierce 12 27.5 140 138 165
Bradley Beal 3 30.7 122
Rasual Butler 8 16.4 60 131 116
Otto Porter 11 24.4 97 106 101
Garrett Temple 12 26.8 121 112 96
Andre Miller 12 12.6 72 69 92
Kris Humphries 11 15.6 46 87 90
Nene Hilario 11 27.1 108 102 68
Drew Gooden 7 18.0 42 40 59
Kevin Seraphin 11 14.8 38 13 17
DeJuan Blair 3 3.7 -41 -40 -40
Glen Rice 5 8.6 -120 -117 -117

This week, I’ve added a column to show each of the previous PPA updates. I’ll keep doing that as long as there’s space.

Wall seems to be settling in at a very high performance level. It’s scary to think there’s still lots of room for improvement too. Seth Partnow at BBall Breakdown did a nice job of summarizing the problem with Wall’s shot selection. Improved decision-making would likely improve the PG’s individual efficiency, and give his team a much-needed boost.

I don’t see how the Wizards could have hoped for more from Pierce, who is performing at a high level in the early going this season.

Nenê suffered a plantar fascia injury to his right foot in the win over Milwaukee. While it’s not good to lose a starter, Nenê has been playing nothing like a starter. His defense shows up as a slight net positive, but doesn’t come close to offsetting his awful offensive efficiency.