My 2015-16 Wizards preview is up at Vice Sports. I won’t steal my own thunder much, except to say that my projection approach says the Wizards will win 41-42 games this season. Not as encouraging as I’d hoped, and I had some mild surprises in the numbers — younger players not being predicted to improve as much as I’d have intuitively expected.
The Washington Wizards vanquished the Toronto Raptors in the first round of the NBA playoffs thanks to an innovative approach conceived by team president Ernie Grunfeld, funded by owner Ted Leonsis, and implemented by head coach Randy Wittman. Drawing upon unique abilities possessed by point guard John Wall, Wittman and Grunfeld developed a plan that in the days before the playoffs sent Wall and center Marcin Gortat on a (until now) top secret mission to prehistoric times.
“It was just a little time travel,” Wall said, stifling a yawn. “Just doing whatever I can to help my teammates out.”
” ‘Time travel?’ He said that?” Wittman snapped when told of Wall’s comment. “Okay, first of all, it’s not time travel. It’s just a way of using John’s ability to alter the space-time continuum to bridge the interdimensional gap between this reality and another in which conditions very much like our prehistoric era continue to exist.”
According to sources, Wall was essential to executing the project, but Gortat volunteered.
“We were going to play Raptor,” the Polish center said. “This way I could study real raptor, see how it move, see how it fight, see how it love. I fight six velociraptor at same time — hand-to-hand. After that, Toronto Raptor not so tough.”
While Gortat engaged in mortal battle with ferocious dinosaurs from the later Cretaceous Period, Wall did no fighting and did not engage with the ferocious reptiles.
“I’m competitive, but I’m not a fighter,” Wall said. “i just mostly slept.”
While Wall’s account of an extended nap — made necessary, he said, by the rigors of time travel — had its charm, it did not stand up to investigation. In reality, Wall executed the second part of the Grunfeldian Plan, and tracked down a pubescent Paul Pierce.
“Paul’s one of the oldest players in the league, and we were concerned about his physical condition,” said Wizards vice president Tommy Sheppard, speaking on condition of anonymity. “By sending John and March back seventy-one million years, we felt we could get March first-hand experience with some velociraptors and we could do something to help Paul get back to top form. This was definitely a two birds, one stone kind of thing.”
Wall’s mission was to locate the young Pierce and persuade him to provide biological samples, including blood, spinal fluid and stem cells. The samples would then be combined in Wittman’s laboratory, located deep beneath the Verizon Center, into a genetic cocktail that would rejuvenate the aging Pierce.
“Gotta say it didn’t take much convincing,” Wall said when he learned that details of his trip were known. “Once I told him about his later self being on a team in the playoffs, his competitive nature kicked in and he wanted to help. ‘Course I first had to beat him in a game of Micropachycephalosaurus before he’d do it, but basketball hadn’t even been invented back then so I had a little bit of an advantage. It was tough, but…well…you saw what happened in round one. Look man, Pierce ain’t changed a bit.”
Successful execution of the Grunfeldian Plan had several positive effects fans could see. Gortat and Pierce performed spectacularly in round one. And, freed from the rigors of researching and theorizing about interdimensional temporal travel, Wittman was able to refocus his attention on coaching the team.
“I looked at the numbers and said to the guys ‘What the hell is this?’ ” Wittman said. “Why are we taking so many two-point jumpers? What’s wrong with you people? Do I have to think of everything? Attack the hoop and shoot threes.”
The plan nearly backfired, however, when Wall, exhausted from interdimensional travel, searching for the younger version of Pierce, and the epic game of Micropachycephalosaurus, played horribly in game one. Sources with knowledge of the situation said Wall recovered thanks to some remaining bottles of Caron Butler’s “Tuff Juice.”
While details remain scarce, preparation for the team’s second round matchup with the Atlanta Hawks involved a journey to Middle Earth where Gortat taught teammates the art of riding the Great Eagles of Manwë. Sources could not corroborate the story with cell phone photos or video by publication time. I was able to obtain this image of a young Marcin Gortat riding one of the Great Eagles in Middle Earth, which Gortat claims is located not far from where he was born in Lodz, Poland.
A young Marcin Gortat riding a Great Eagle of Manwë.
Player Production Average: First Round
Player Production Average (PPA) is an overall rating stat I developed that credits players for things they do that help a team win and debits them for things that hurt the cause. PPA is pace neutral, accounts for defense, and includes a “degree of difficulty” factor based on the level of competition a player faces while on the floor. In PPA, 100 = average, higher is better and replacement level is 45.
WASHINGTON WIZARDS
POS
GMS
MPG
PPA
Marcin Gortat
C
4
31.3
294
Paul Pierce
SF
4
28.5
209
Will Bynum
SG
1
4.0
183
John Wall
PG
4
38.0
165
Otto Porter
SF
4
32.0
147
Kris Humphries
PF
1
5.0
146
Bradley Beal
SG
4
41.8
116
Drew Gooden
PF
4
20.5
107
Nene Hilario
PF
4
24.3
82
Ramon Sessions
PG
4
16.5
67
Kevin Seraphin
C
3
11.0
50
Martell Webster
SF
1
4.0
36
Rasual Butler
SF
2
3.5
-85
TORONTO RAPTORS
POS
GMS
MPG
PPA
Greg Stiemsma
C
1
2.0
535
Jonas Valanciunas
C
4
26.5
142
Patrick Patterson
PF
4
26.5
122
Amir Johnson
PF
4
28.0
91
DeMar DeRozan
SG
4
39.8
75
Terrence Ross
SF
4
26.8
38
Lou Williams
SG
4
25.5
26
Greivis Vasquez
PG
4
25.3
14
Kyle Lowry
PG
4
32.8
-6
Tyler Hansbrough
PF
4
12.0
-13
James Johnson
PF
2
6.0
-118
While the playoffs are the most important part of the NBA season, fans and analysts tend to go overboard in using postseason results to reach new conclusions. The Wizards were impressive in round one, but it’s worth keeping in mind that any given round of the post-season (especially a four-game sweep) is the very definition of Small Sample Size Theater. Bradley Beal led the Wizards with 167 minutes in the first round.
I’d caution against overreaching in using the win over Toronto to make a significant reassessment of the Wizards. They’ll get a tougher test against the Hawks.
That said, the good news from round one was getting good production from the team’s youthful triumvirate. Washington was led by Gortat and Pierce, both of whom were outlandishly efficient, and got outstanding play from Wall and Otto Porter, and solid production from Bradley Beal.
Unsurprisingly (considering Washington’s resounding series win), five Wizards were more productive than the most productive Toronto player. The Raptors were hampered by an extreme lack of production from its backcourt, including a net negative performance from All-Star Kyle Lowry.
Meanwhile, Gortat was the league’s most productive player in the first round, and Pierce’s production ranked eighth.
The Wizards concluded the regular season portion of a #SoWizards season losing back-to-back overtime games. The first of those losses — a double overtime snoozer against Indiana — was perhaps the most #SoWizards moment of the season: on the eve of the playoffs, Randy Wittman played John Wall, Marcin Gortat, Bradley Beal, Otto Porter and Drew Gooden more than 38 minutes each in a desperate effort to win a game that meant literally nothing to the Wizards.
Washington concluded the season 46-35, two wins better than last year’s record (and one game better than my pre-season projection). And yet, there’s a pervasive discontent with the team and its management. Some of the disappointment is a reaction to expectations that were pushed beyond the bonds of reality when the team was rolling through the junior varsity portion of their early-season schedule.
The dissatisfaction may run deeper than simply feeling let down that Washington didn’t get to 50-plus wins for the first time since the 1978-79 season. I think part of the reaction is the collective realization that what’s been sold to Wizards fans the past couple seasons has been kind of a fraud.
Getting above .500 and making the playoffs was supposed to be a sign of growth. It was supposed to be a progression. First, have a chance to win most nights. Second, make the playoffs and gain valuable experience. Third, build on that trip to the playoffs and ride the improvement of the team’s young core to deeper and deeper postseason runs until they can compete for a title.
But, making the playoffs has been built largely on NBA senior citizens who had something left in the tank, but not much of a future. In the span of a few short years, the Wizards paid a steep price in player acquisition resources to construct and old team. Sure, the old guys can be replaced, but the man leading the rebuild is likely to be the same one who steered the franchise into a ditch and then perpetrated the “fraud.” There is little reason to have confidence in Ernie Grunfeld reconstructing the roster in a manner that will make it anything other than a mid-level playoff team.
Meanwhile, their young core — Wall, Beal and Porter — hasn’t improved much. Wall has made the biggest improvement, yet still ranks solidly below the game’s elite. The best that can be said of Beal and Porter is that they possess potential. Whether that potential ends up getting translated into meaningful production is a question mark, especially considering how poorly the team is coached.
In general, fans overrate the impact of coaches. It’s clear, however, the Wizards operate at something of a disadvantage because of Randy Wittman’s antiquated notions of offensive basketball. Washington actually shoots the ball decently, but they’re rendered less efficient than they could be by their reliance on two-point jumpers. As has been pointed out numerous times by numerous commentators, two-point jumpers are exactly the shot the defense wants an opposing offense to take. The Wizards offense is built around that shot.
It’s almost impossible to unpack how much Wittman’s offense hinders the Wizards. I’ll give it a shot during the offseason, though.
On the bright side, there’s the team’s defense — fifth best in the league this year, and in a virtual tie with Golden State for league’s best over the last half of the season.
I’m hoping to have some playoffs analysis up tomorrow, but for now, here are the final PPA numbers for the Wizards.
Player Production Average Update
Player Production Average (PPA) is an overall rating stat I developed that credits players for things they do that help a team win and debits them for things that hurt the cause. PPA is pace neutral, accounts for defense, and includes a “degree of difficulty” factor based on the level of competition a player faces while on the floor. In PPA, 100 = average, higher is better and replacement level is 45.
The numbers under each date represent the player’s PPA for the entire season to that date. The number in the far right column (labeled PPA) is the player’s current PPA through games played last night. For a look at how players on other teams rate, visit here.
Perhaps Wall was cruising over the last couple months of the season. He still ended up with the best PPA of his career (he posted a 139 each of the preceding two seasons), but I’m convinced he’s capable of MUCH more. The areas for biggest improvement remain what they’ve been since he entered the league: shooting from the floor and turnovers.
By my reckoning, this was the second best season of Gortat’s career (the best was a 186 PPA with Phoenix (and Steve Nash) in 2011-12). He was edged out by Wall in total production because Wall played more minutes. He’s not an elite center, but he’s more than solid.
Paul Pierce made news this week with candid comments in an interview with ESPN. While his production has declined during the season, his overall performance has been remarkable for his age. In my historical database (which goes back to 1977-78), Pierce’s 126 PPA is the best season for a 37-year old SF. The closest contenders are Scottie Pippen (120) and Dominique Wilkins (119).
After those three, it’s difficult to generate much to say that’s positive. Beal ended up a hair below average for a third straight season. Nenê continued to decline. This was his least productive season since he was 25 years old. It’s a good thing his contract expires after next season.
The bright side for Washington is that they play in the epically weak Eastern Conference. As mediocre as they are (and they are mediocre), they have a chance in the first round against the vulnerable Toronto Raptors. More on that tomorrow.
There’s a temptation to note the Wizards have won four in a row and five of their last six and conclude they’re headed for the playoffs in good form. I don’t share that optimism, however. This is a stretch of games where Washington was expected to win with four games against three of the league’s weakest teams — Charlotte (21st in Simple Rating System — a power ranking published by Basketball-Reference.com that combines scoring differential with strength of schedule), New York (30th) and Philadelphia (29th) twice.
Failing to win at least four of the six would have been cause for real concern. Getting an “extra” win against Memphis was encouraging, although it’s worth noting the Grizzlies were coming off a hard-fought win against Oklahoma City the previous night while the Wizards coasted to an easy (and restful — the only starter to play more than 30 minutes was Bradley Beal) over the hapless Knicks.
The Wizards aren’t “fixed,” they’re playing bad opponents. It’s good that they’re beating those teams, but that’s not the same as saying they’re in good shape. Realistically speaking, they continue to look how they’ve looked all season — a slightly better than average team that feasts on the 99-pound weaklings in the East and can sometimes summon the game to challenge (and even beat) a good team if stuff goes right for them and wrong for the other side.
The preceding is talking about the team’s big picture. The overall. They’re excellent on defense, and have been since the end of January. Unfortunately, their offense has been terrible during the same time frame. Since the playoffs are about to start, we’re about to hear a bunch of the old maxim that defense wins in the postseason. Like a lot of truisms, it’s half true. Unless the Wizards are able to operate with some level of offensive efficiency against higher-quality opponents, they’re not going deep in the playoffs.
I’ll get more into postseason matchups when the regular season concludes, but it does help that Washington is in the East. First, because they’ll be in the playoffs at all. Out West, they’d at best be scrapping for the eighth seed. In their actual conference, they’ll have a punchers chance in the first round against Toronto or Chicago.
Player Production Average Update
Player Production Average (PPA) is an overall rating stat I developed that credits players for things they do that help a team win and debits them for things that hurt the cause. PPA is pace neutral, accounts for defense, and includes a “degree of difficulty” factor based on the level of competition a player faces while on the floor. In PPA, 100 = average, higher is better and replacement level is 45.
The numbers under each date represent the player’s PPA for the entire season to that date. The number in the far right column (labeled PPA) is the player’s current PPA through games played last night. For a look at how players on other teams rate, visit here.
Searching for encouragement as the playoffs approach? Look at Gortat and Wall — both of whom have been consistently good all season. Beal has played better the past few weeks, as have Sessions, Porter and Gooden.
On the other hand, Nenê and Pierce have struggled. The hope is that they’re recharging for the playoffs. But, they’re also the team’s oldest players, and they could be wearing down from the long season.
After a lengthy stretch of losing basketball, the Wizards have won four of their last six. Have they shaken off their mid-season swoon? Are they poised to win like it’s November or December?
No, and not likely.
While the Wizards have played better over the past six games, their offense has remained below average, and their defense has been unsustainably fantabulous. During this 4-2 stretch, Washington has allowed its opponents just 96.5 points per 100 possessions. If they managed to do that over a full season, they’d be one of the 15 best defenses since 1973-74 when the league began collecting the stats necessary to calculate defensive rating. For the season, the Wizards are allowing 102.8 points per 100 possessions.
Another factor: they’ve had the good fortune of meeting injury-depleted teams. And even then, the results have been mixed. They lost to Chicago, which was missing Jimmy Butler, Derrick Rose and Taj Gibson. They eked out a two-point victory against Miami, which didn’t have Chris Bosh, Dwyane Wade or Luol Deng. And, they beat the snot out of Memphis, which lacked Mike Conley, Tony Allen, Marc Gasol and Zach Randolph — also known as the Grizzlies’ four best players.
I know Randy Wittman and Ernie Grunfeld have said the Wizards just need to play better on defense and work harder. I respectfully disagree. Their defense — even during the period of sustained losing — wasn’t bad. The decline has been on offense, and it still needs to be fixed.
Player Production Average Update
Player Production Average (PPA) is an overall rating stat I developed that credits players for things they do that help a team win and debits them for things that hurt the cause. PPA is pace neutral, accounts for defense, and includes a “degree of difficulty” factor based on the level of competition a player faces while on the floor. In PPA, 100 = average, higher is better and replacement level is 45.
The numbers under each date represent the player’s PPA for the entire season to that date. The number in the far right column (labeled PPA) is the player’s current PPA through games played last night. For a look at how players on other teams rate, visit here.
My apologies for the format. The spreadsheet has reached a width that WordPress struggles to accommodate.
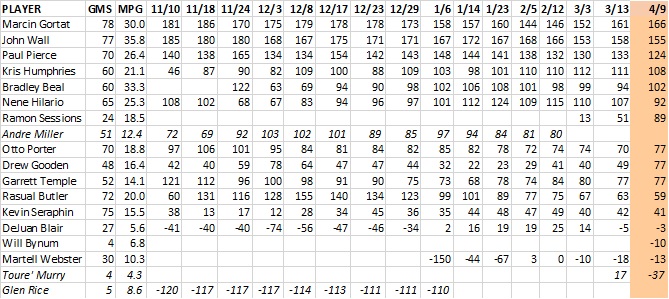
Good weeks for Gortat, Wall, Pierce and Gooden. Not so good for Beal, Temple, Porter and Butler.
Ramon Sessions provided hope with a couple decent games.
Martell Webster isn’t able to physically compete at an NBA level, presumably because of his back.
I’ve thought all season that DeJuan Blair should have been playing ahead of Kevin Seraphin, but Blair looks unable to compete physically at an NBA level because of too much eating and insufficient exercise.
Drew Gooden celebrates being the biggest improver in this week’s Player Production Average update.
Charles Barkley doesn’t like analytics. His argument works out to this: “I don’t know anything about analytics and I never will. Also, you stat people never played the game and couldn’t get girls in high school.”
Partial credit to the new number one on my list of people I’d like to meet at a poker table — I didn’t “get girls” in high school, perhaps because I was too busy playing basketball.
Of course, if we apply Barkley’s fatuous logic that only people who have played the game are qualified to offer opinions about the game, then only people who have done analytics would be qualified to offer opinions about analytics. Which means, by Barkley’s own Rules of Living, we should all shut the hell up — on a lot of things. Hmm, maybe he’s on to something.
Despite Barkley’s assertion that “analytics don’t work,” the facts are that in recent years, top teams have made extensive use of analytics to improve their teams. Of course, there are crappy teams that use analytics, but the same was true when teams were built by Men Who Stared At Players.
Analytics are not an end to themselves, and they’re not intended to eliminate people from decision-making. They’re tools to help inform decisions — sorta like being able to estimate odds in poker. You’re playing both the cards and the people across the table, but it’s a sucker who wagers without a good sense for their chances of winning. Which reminds me that Barkley really sucks at gambling.
Speaking of analytics, the Wizards could use some help. Despite dominating wins over sad-sack Brooklyn and Orlando, there’s a pervasive sense of gloom about the team lately. Since starting the season 22-8, they’re 11-13. The struggles weren’t a shock — it was the toughest part of the team’s schedule.
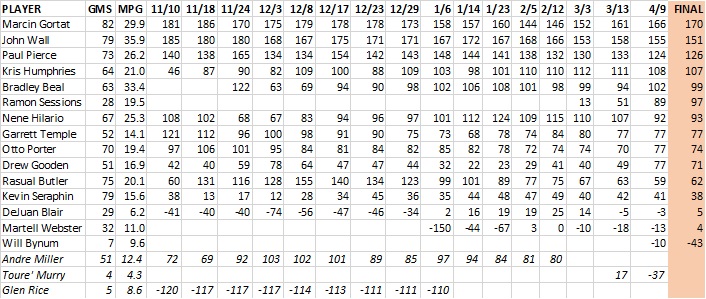
Age — Production has dropped significantly over the past month for the team’s oldest players, Paul Pierce and Andre Miller. Nenê has been doing better, but remains below average for a starter. The team has been terrific with him on the floor, however. And, in the “no shock” category, Rasual Butler’s production has dropped.
No Elite Producers — No, not even Wall, at least not on a per minute basis. His PPA (see below) is 166. That would rank fourth on the Atlanta Hawks behind Al Horford (203), Jeff Teague (190), and Paul Millsap (175). Among players with at least 500 minutes this season, Wall ranks 30th in per minute production. He’s 11th in total production, so I’ll take that as an argument in favor of “elite” status, even though he’s played the second most minutes in the league this year, and seven of the 10 ahead of him have played significantly fewer minutes. Wall IS playing well. But, I think there’s still major room for improvement.
Kevin Seraphin — He was better in January, but seems to have flattened out in February. Overall, he continues to rate right around replacement level. I think the team can get by with him against bad teams, but will need better play off the bench when they face tougher competition.
Lack of Progress From The Youngsters — Bradley Beal’s PPA has been hovering in the average range; Porter’s in the below-average-but-still-useful range. But, neither guy has taken a significant step forward, and now Beal is sidelined for a third time with a “stress reaction” in his leg.
Health — Beal with the stress reaction. Webster recovering from back surgery. Wall with the migraines and the (maybe) Achilles soreness, and/or ankle soreness. Humphries with the back. Nothing major yet, but these bumps and bruises can affect productivity, and there are always injury concerns with older players.
Weekly Player Production Average Update
Player Production Average (PPA) is an overall rating stat I developed that credits players for things they do that help a team win and debits them for things that hurt the cause. PPA is pace neutral, accounts for defense, and includes a “degree of difficulty” factor based on the level of competition a player faces while on the floor. In PPA, 100 = average, higher is better and replacement level is 45.
The numbers under each date represent the player’s PPA for the entire season to that date. The number in the far right column (labeled PPA) is the player’s current PPA through games played last night. For a look at how players on other teams rate, visit here.
My apologies on the format, but I was running out of space for the full week-by-week PPA table. By the end of the season, we’ll all need a magnifying glass to read it.
A lot of consistency at this point. Most of the guys seem to have found their levels. My biggest worries are with the old guys, who seem to be wearing down as the season progresses. Hopefully they’ll be rejuvenated by this year’s extra-long All-Star break.
So little time today, but I want to get the numbers up and address one topic: the (apparently) Official Wizards Fan Talking Point that the the Wizards are a “good” team going through a tough stretch.
While there’s a certain appeal to that position, and its supporters could point to the team’s record as evidence, the numbers simply don’t agree. The key stat to understand relative team strength is scoring differential — even more than record. The guys at Basketball-Reference created a robust team strength measure they call Simple Rating System (SRS), which combines scoring differential and strength of schedule.
In SRS, the WIzards have bounced around a bit this season, climbing into the top 10 for a week early on, but steadily sliding since then. Now emerging from the toughest part of their schedule, Washington ranks 16th in SRS — now behind Milwaukee. Consider that the Bucks and Wizards have played schedules of identical difficulty (0.63 points per game worse than average), but the Bucks have outscored their opponents by 1.96 points per game — the Wizards 1.66. A small difference to be sure, but it’s meaningful over the course of the marathon NBA season.
The data says that Washington isn’t a bad team, but it’s not good either. It’s a little better than average with a record made superficially better by the woeful state of the Eastern Conference. Because of the weak conference, the Wizards still have a decent shot at a top three seed, and a reasonable chance of advancing past the first round.
But, the problem isn’t that they’ve “just gotten out of sync” or that they’re not playing hard enough. It’s that they’re just not that good. Their margin for success each night is slender, and on nights when they’re not playing at something close to their best, they’re vulnerable.
Weekly Player Production Average Update
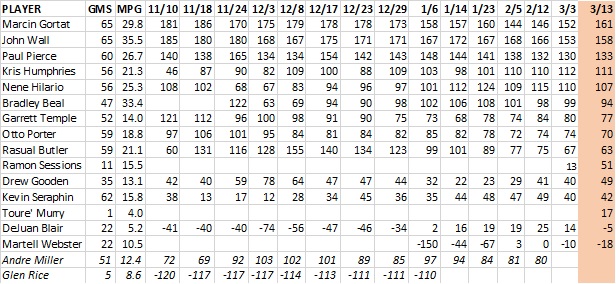
Player Production Average (PPA) is an overall rating stat I developed that credits players for things they do that help a team win and debits them for things that hurt the cause. PPA is pace neutral, accounts for defense, and includes a “degree of difficulty” factor based on the level of competition a player faces while on the floor. In PPA, 100 = average, higher is better and replacement level is 45.
The numbers under each date represent the player’s PPA for the entire season to that date. The number in the far right column (labeled PPA) is the player’s current PPA through games played last night. For a look at how players on other teams rate, visit here.
PLAYER
GMS
MPG
11/10
11/18
11/24
12/3
12/8
12/17
12/23
12/29
1/6
1/14
1/23
PPA
John Wall
50
35.9
185
180
180
168
167
175
171
171
167
172
167
168
Marcin Gortat
50
29.5
181
186
170
175
179
178
178
173
158
157
160
144
Paul Pierce
47
26.9
140
138
165
134
134
154
142
143
148
144
141
138
Nene Hilario
42
25.5
108
102
68
67
83
94
96
97
101
112
124
109
Bradley Beal
41
34.0
122
63
69
94
90
98
102
106
108
101
Kris Humphries
49
22.0
46
87
90
82
109
100
88
109
103
98
101
110
Rasual Butler
46
20.8
60
131
116
128
155
140
134
123
99
101
89
77
Andre Miller
48
12.2
72
69
92
103
102
101
89
85
97
94
84
81
Otto Porter
45
18.0
97
106
101
95
84
81
84
82
85
82
78
72
Garrett Temple
38
11.7
121
112
96
100
98
91
90
75
73
68
78
74
Kevin Seraphin
49
15.6
38
13
17
12
28
34
45
36
35
44
48
47
Drew Gooden
23
12.0
42
40
59
78
64
47
47
44
32
22
23
29
DeJuan Blair
14
4.6
-41
-40
-40
-74
-56
-47
-46
-34
2
16
19
19
Martell Webster
13
10.0
-150
-44
-67
3
Glen Rice
5
8.6
-120
-117
-117
-117
-114
-113
-111
-111
-110
-110
-110
-109
No big surprises here. As would be expected for a team in a four-game losing streak, production has dipped for several players. Biggest decliners: the old guys — Gortat, Nenê, and Butler. The only real “improver” was Humphries. For the Seraphin watchers, the big fella stabilized right around replacement level since the last update.
Tight schedule this week, so not much commentary. A few brief thoughts:
Congratulations to John Wall for receiving a well-deserved spot in his second All-Star game. Many more to come for the Wizards PG.
Hearkening back to last week’s piece, in which I compared this year’s Wizards to teams in NBA history with a similar SRS (stands for Simple Rating System — it’s a measure of team strength that combines scoring margin with strength of schedule), there’s this: In NBA history (including this year to-date), 247 teams have had a winning percentage of 65% or better. (The Wizards are currently at .674.) Where does Washington’s squad this year stand on that list in SRS? 247th.
During a game this week, CSN threw onto the screen one of its pointless, irrelevant and cherrypicked “stats.” In this case, it was something about Kevin Seraphin being among the league leaders in 4th quarter FGs. The information was correct, but without meaning. Seraphin is among the league leaders in 4th quarter minutes played, 4th quarter turnovers and 4th quarter fouls. He’s played more than twice as many 4th quarter minutes as Marcin Gortat. When I checked, he had one fewer 4th quarter rebounds than Damian Lillard. Seraphin’s 4th quarter PPA: an anemic 59. And oh yeah, the Wizards have been outscored by 53 points (9.0 points per 48 minutes) during Seraphin’s time on the floor during the 4th quarter.
Weekly Player Production Average Update
Player Production Average (PPA) is an overall rating stat I developed that credits players for things they do that help a team win and debits them for things that hurt the cause. PPA is pace neutral, accounts for defense, and includes a “degree of difficulty” factor based on the level of competition a player faces while on the floor. In PPA, 100 = average, higher is better and replacement level is 45.
PLAYER
GMS
MPG
11/10
11/18
11/24
12/3
12/8
12/17
12/23
12/29
1/6
1/14
PPA
John Wall
43
35.5
185
180
180
168
167
175
171
171
167
172
167
Marcin Gortat
43
29.6
181
186
170
175
179
178
178
173
158
157
160
Paul Pierce
41
26.7
140
138
165
134
134
154
142
143
148
144
141
Nene Hilario
36
24.8
108
102
68
67
83
94
96
97
101
112
124
Bradley Beal
34
33.4
122
63
69
94
90
98
102
106
108
Kris Humphries
42
21.3
46
87
90
82
109
100
88
109
103
98
101
Rasual Butler
39
22.5
60
131
116
128
155
140
134
123
99
101
89
Andre Miller
43
12.6
72
69
92
103
102
101
89
85
97
94
84
Otto Porter
39
18.0
97
106
101
95
84
81
84
82
85
82
78
Garrett Temple
32
11.9
121
112
96
100
98
91
90
75
73
68
78
Kevin Seraphin
42
15.6
38
13
17
12
28
34
45
36
35
44
48
Drew Gooden
22
11.9
42
40
59
78
64
47
47
44
32
22
23
DeJuan Blair
14
4.6
-41
-40
-40
-74
-56
-47
-46
-34
2
16
19
Martell Webster
8
9.8
-150
-44
-67
Glen Rice
5
8.6
-120
-117
-117
-117
-114
-113
-111
-111
-110
-110
-110
Largely a status quo update. Wall and Pierce were down a little, but Gortat, Nenê and Beal were up. Rasual Butler and Andre Miller had rough weeks. Seraphin’s production rate crept past replacement level.
The Wizards continue to rack up wins — even over the last 10 games, which has been the team’s most challenging stretch of the year. Last night, they did something that has me typing words that would have been difficult to imagine typing just last season: Fueled by a strong performance from Kevin Seraphin, Washington blew open a close contest late to secure a comfortable win against the San Antonio Spurs.
It was the team’s first win over the Spurs since 2005. The team’s record now sits at 26-12, good for second in their division and in the conference. Their .684 winning percentage is that of a 56-win team over an 82-game schedule — rarefied air for this franchise.
But…are they really that good? Basketball analytics has shown that scoring differential is a better predictor of team strength than its record. Luck can push a team’s record up or down a few wins, but how much it outscores its opponents offers a truer measure of relative strength.
So far this season, Washington’s scoring differential is +2.13, a mark that would suggest a 47-win team. Add in their weak schedule (fifth easiest in the league), and their differential falls to +1.49, which would suggest a 45-win team.
That +1.49 is Basketball-Reference’s Simple Rating System, a strength rating that combines scoring differential with strength of schedule. Of teams in NBA history with a similar SRS (between +1.0 and +2.0), the Wizards have the best winning percentage. They’re at .684 so far. Next closest is the 1961-62 Lakers at .675.
Of the 115 teams in that similar SRS grouping, the average winning percentage is .554 — so, 45 wins.
Narrow the focus to an SRS between +1.4 and +1.6, and the field is cut to 17 teams. And the winning percentage drops to .541 — about 44 wins.
But, here’s where that strength of schedule thing works in Washington’s favor. While the Wizards aren’t overwhelmingly strong, the East remains historically weak. Their schedule the rest of the way is about 0.7 points per game weaker than average — roughly the quality of a 39-win team the rest of the way. Because of that, Washington projects to finish with 51-53 wins, even without improving their scoring differential.
Weekly Player Production Average Update
Player Production Average (PPA) is an overall rating stat I developed that credits players for things they do that help a team win and debits them for things that hurt the cause. PPA is pace neutral, accounts for defense, and includes a “degree of difficulty” factor based on the level of competition a player faces while on the floor. In PPA, 100 = average, higher is better and replacement level is 45.
PLAYER
GMS
MPG
11/10
11/18
11/24
12/3
12/8
12/17
12/23
12/29
1/6
PPA
John Wall
38
35.5
185
180
180
168
167
175
171
171
167
172
Marcin Gortat
38
29.5
181
186
170
175
179
178
178
173
158
157
Paul Pierce
36
26.4
140
138
165
134
134
154
142
143
148
144
Nene Hilario
31
24.5
108
102
68
67
83
94
96
97
101
112
Bradley Beal
29
33.4
122
63
69
94
90
98
102
106
Rasual Butler
34
22.7
60
131
116
128
155
140
134
123
99
101
Kris Humphries
37
21.5
46
87
90
82
109
100
88
109
103
98
Andre Miller
38
12.6
72
69
92
103
102
101
89
85
97
94
Otto Porter
28
18.2
97
106
101
95
84
81
84
82
85
82
Garrett Temple
29
12.8
121
112
96
100
98
91
90
75
73
68
Kevin Seraphin
37
15.6
38
13
17
12
28
34
45
36
35
44
Drew Gooden
21
12.2
42
40
59
78
64
47
47
44
32
22
DeJuan Blair
12
4.8
-41
-40
-40
-74
-56
-47
-46
-34
2
16
Martell Webster
5
11.6
-150
-44
Glen Rice
5
8.6
-120
-117
-117
-117
-114
-113
-111
-111
-110
-110
It was fun to see Seraphin follow a good performance against the Hawks with an outstanding one against the Spurs. But, it’s going to take a sustained run of solid play from the big fella to convince me he belongs in the rotation. Previous analysis of Seraphin’s game log showed he has an above average game about 20% of the time. Over the course of an 82-game schedule, it’s almost inevitable that he’d have at least one two-game sequence where he performs above average in each. There’s approximately a 47% chance he’ll have a three-game sequence in which he performs above average.
In fact, he’s already done it this season against Denver, at Boston and home against Boston from December 5-8. He followed up that three-game stretch with a meh game at Orlando, two negative games against the Clippers and Jazz, and then a replacement level performance against Minnesota. If you want a sign that he’s truly improved, wait until he’s strong together four or more consecutive above average performances.
Also good: upticks in performance from Wall, Nenê, and Beal. Gortat’s performance was flat, but significantly down his production in December.
There seems to be some sentiment among Wizards fans (and maybe even the coach) that the team needs a backup PG to replace or supplement Miller. While Miller is a defensive liability, his overall performance (which is what matters) has been solid.
If the team is looking to upgrade for the second half of the season, it wouldn’t hurt to add a third PG for insurance. But, more pressing issues are Seraphin as the backup center, and perhaps a more athletic 3&D type to backup Beal.
While fans worried during Washington’s three-game losing streak over the past week, the Wizards completed a successful road trip against Western Conference opponents with wins over Houston and New Orleans. Entering the trip as decided underdogs in all five contests, the Wizards were competitive in all but the Dallas game — which came the night after a gritty win against the Rockets.
Upon completion of the trip, I updated my “who’s gonna win” calculator and projected the Wizards’ final record. At the Washington Post this week, columnist Thomas Boswell did a nice job explaining why the Wizards aren’t as good as their record. Everything Boswell wrote is valid and correct, but…being in the Eastern Conference this season is incredibly fortunate for a middle-of-the-pack team like the Wizards.
My biggest concerns for the Wizards going forward are these:
Age — Many seem to think this is a young team, but it’s not. They have the league’s 7th oldest rotation, and they’re reliant on 30+ year olds in key roles — including the 38-year old Andre Miller and the 37-year old Paul Pierce. And there’s Nenê, whose play has declined the past couple years as he’s suffered through a series of nagging injuries.
No elite producers — I can hear the screens breaking all over the DC area. What about John Wall?! He’s an All-Star, a top five PG, and you wrote last week that he’s the league’s best defensive PG. Well, some of that is true. But, good as Wall has been this season, he’s still well behind the game’s elite players when it comes to doing things that cause a team to win. As I’ve pointed out previously, Wall does a lot of good things when he’s on the floor, but…he also does a lot of things that hurt — specifically turnovers, missed shots and poor shot selection. To become an elite team, the Wizards need him to play even better than he already has.
Kevin Seraphin— The coaches keep playing him, and in games against weaker opponents he doesn’t hurt too much. Against better teams, it hurts to have Seraphin in the lineup. That was apparent in the loss against Oklahoma City. In a game the Wizards lost by seven, they were -11 when Seraphin was on the floor. For those who don’t want to do the math, that means Washington was +7 when he was on the bench.
Lack of Progress from the youngsters — I’m a big fan of Bradley Beal and Otto Porter, but both guys have been pretty average so far. Beal’s 102 PPA (see below) is a modest improvement, but is below average for a starter (125). Porter has been okay as a backup, and is performing at a level similar to that of players with similar collegiate production. Neither guy has demonstrated they should be considered foundational players for the Wizards. And, I think Washington will need one of the two (preferably Beal) to make that leap this season if they hope to reach the conference Finals…or more.
Coaching — Encouraged by head coach Randy Wittman, the Wizards continue to take too many two-point jumpers. Sometimes they’re necessary, but the math is abundantly clear that they’re bad shots — exactly the ones the defense wants them to take.
Weekly Player Production Average Update
Player Production Average (PPA) is an overall rating stat I developed that credits players for things they do that help a team win and debits them for things that hurt the cause. PPA is pace neutral, accounts for defense, and includes a “degree of difficulty” factor based on the level of competition a player faces while on the floor. In PPA, 100 = average, higher is better and replacement level is 45.
PLAYER
GMS
MPG
11/10
11/18
11/24
12/03
12/08
12/17
12/23
12/29
PPA
John Wall
29
35.6
185
180
180
168
167
175
171
171
167
Marcin Gortat
29
29.6
181
186
170
175
179
178
178
173
158
Paul Pierce
28
26.4
140
138
165
134
134
154
142
143
148
Kris Humphries
28
21.7
46
87
90
82
109
100
88
109
103
Bradley Beal
20
33.2
122
63
69
94
90
98
102
Nene Hilario
22
24.2
108
102
68
67
83
94
96
97
101
Rasual Butler
25
22.6
60
131
116
128
155
140
134
123
99
Andre Miller
29
12.8
72
69
92
103
102
101
89
85
97
Otto Porter
28
18.7
97
106
101
95
84
81
84
82
85
Garrett Temple
25
14.0
121
112
96
100
98
91
90
75
73
Kevin Seraphin
28
15.4
38
13
17
12
28
34
45
36
35
Drew Gooden
18
13.1
42
40
59
78
64
47
47
44
32
DeJuan Blair
9
5.0
-41
-40
-40
-74
-56
-47
-46
-34
2
Glen Rice
5
8.6
-120
-117
-117
-117
-114
-113
-111
-111
-110
Martell Webster
2
10.0
-150
No major surprises considering the team went 2-3 over the past week. Wall took over the top spot in the team’s PPA rankings because Gortat’s play dropped further.
Rasual Butler’s anticipated reversion to the mean is in progress. Hopefully, Beal’s play will improve as Butler’s dips.
Seraphin held steady…below replacement level.
For the first time in weeks, the Wizards dusted off DeJuan Blair, and he moved his PPA out of negative territory.
Martell Webster looked terrible in his return from back surgery.
 My 2015-16 Wizards preview is up at Vice Sports. I won’t steal my own thunder much, except to say that my projection approach says the Wizards will win 41-42 games this season. Not as encouraging as I’d hoped, and I had some mild surprises in the numbers — younger players not being predicted to improve as much as I’d have intuitively expected.