Yesterday, Wizards head coach Randy Wittman appeared Sportstalk 980’s “Sports Fix” with Kevin Sheehan and Thom Loverro (as transcribed by the Washington Post’s Dan Steinberg) and provided a treasure trove of comments worth some analysis.
Let’s unpack a bit, shall we?
Writes Steinberg:
The Wizards have their own special history with the [analytics]. There were critics throughout much of the 2014-2015 season who wanted Randy Wittman’s Wizards to play a smaller, faster, more three-point-friendly game, and who sometimes used numbers to make their case. Owner Ted Leonsis, at least in one blog post, seemed sympathetic with their cause.
ESPN the Magazine gave the Wizards a mediocre “analytics” rating, writing that “Washington lags in terms of applying the lessons of analytics to its shot chart even in the midst of the team’s best season since 1978-79.” The Wizards went smaller in the playoffs and found some success. After the season ended, the Wizards held an “analytics” scrimmage, and Leonsis defended the franchise’s use of analytics. And by the start of this season, they were debuting a faster “pace and space” offense that seemed more aligned with modern NBA thinking.
A very fair and cogent summary of the Wizards’ recent history with statistical analysis. The thing that makes me twitch is the notion that “analytics” said the Wizards should play faster. The numbers I track indicated that a) playing fast hadn’t helped the team in recent years, b) that if anything the Wizards were slightly better in slower-paced games, and c) that playing fast or slow or in-between is a bad goal because it doesn’t mean anything. There’s no prize for having a lot of possessions.
During 2014-15 (and the several preceding seasons where stat guys made similar points), the lesson from the numbers was that the Wizards could benefit by exchanging two-point jumpers for threes, at-rim attempts and free throws — to the extent possible. The team’s “go fast” approach was a leap of faith unsupported by the numbers.
From Steinberg:
At least one local critic — ESPN 980 host Kevin Sheehan — has pointed the finger at the “analytics”-inspired change.
“I wouldn’t be surprised if we find out down the road that this small lineup pace-and-space style of play was forced on Randy Wittman and his staff,” Sheehan said recently, “forced on them by some advanced-analytics stats geek who convinced the technological visionary who owns the team that this team was stuck in yesteryear, that this team was stuck in old ways of playing basketball that weren’t going to work anymore:
“Hey Ted, Ted, I’ve got this logarithm that I wrote, it’s really cool stuff, I got the idea from an app that I created for sci-fi movies and it’s really gonna work in the NBA, bad twos, you can’t take those anymore, you’ve got to take threes, you’ve got to space and pace, you’ve got to go small, you’ve got to play a stretch 4, this is the way of the future, Ted, this is the way you’ve got to do it. And Ted said to Randy ‘Hey Randy, what do you think about this pace and space and stretch 4s and shoot more threes and it worked in the playoffs and we almost made it to the Eastern Conference finals.
“Jesus!” Sheehan concluded. “This whole thing all season long is just a blown opportunity. A major blown opportunity. I would love to know what Ted is thinking right now.”
If Washington has a stat goober who told them the numbers said they should play fast, he should be fired. Second, the space part of the new offense has probably helped a bit. Last season, the team ranked 22nd in offensive efficiency, 1.9 points per 100 possessions below league average. So far this season, they rank 18th — about 1.0 points per 100 possessions below average.
This is a fairly small effect, which at least one stat goober expected before the season. The Wizards weren’t the only team to apply the lessons of statistical analysis, defenses have been adapting, and games generally come down to overall talent and execution. And the team has middle-of-the-road talent.
Washington’s real problem, of course, has been defense, which has nothing to do with pace or space. Last year, they ranked fifth overall defensively, 2.6 points per 100 possessions better than average. This year: 17th, about a half point per 100 possessions below average. Over the past two seasons (individually or combined), there was no relationship between pace and defensive efficiency.
Appearing on Sheehan and Loverro’s show, Wittman had this to say (courtesy Steinberg):
“I’ve got to coach the team. Analytics haven’t won a ballgame. You’ve got to take what you have and put guys in position that they can best succeed at. And there are some things with numbers that help that, but if you see some of the number sheets that we have, it would drive you crazy. But you know what, that’s the world we live in. You can fight that, but that does you no good. Listen, I’ve been in the business 32 years now. We had analytics back in the ’80s, alright? We had numbers. Plus-minus, and guys playing with certain guys, and that’s never changed. It’s just now, for whatever reason … Hey, it’s good for some people. Because guys have gotten a lot of jobs because of that word.”
A few thoughts. “Analytics” is the study of what wins and loses basketball games. “Analytics” are drawn from the actual games. They’re not made up. When done well, they reveal what’s really happening on the floor, pinpoint what’s important, help coaches and players identify advantages and disadvantages that can be discerned in the numbers, but might escape the naked eye. Analytics are a tool to help coaches and players perform their jobs better, and (hopefully) win more games.
Wittman’s comments suggest the Wizards have some serious internal problems, though — and NOT because he’s resistant to “analytics.” The telling statement is “…if you see some of the number sheets that we have, it would drive you crazy…”
A head coach should not be getting buried with sheets of numbers. He’s a basketball coach, not a statistical analyst. Like many busy people, when presented with an overload of information, he’s going to ignore most of it, seize on a few things he thinks he understands, and then go with what his experience tells him is the right strategy.
The proper role for a statistical analyst is to crunch the numbers, perform the analysis, and then communicate the findings in a way that coaches and decision-makers can understand. If Wittman is being driven crazy by the data, then the analysis department is failing. It sounds like the Wizards may be missing the crucial ability to communicate the findings of their analysts.
Also worth considering is the kind of numbers and information being analyzed and presented. It has become fashionable in recent years to break players into their component skills and seek to construct a roster as if completing a puzzle.
Based on comments made by GM Ernie Grunfeld, the Wizards are big into this kind of analysis. Symptoms include statements such as: the team needs to add “shooting” or “defense” or “rebounding” or “ball handling” or “length” or…you get the idea. As if “shooting” can be “added” to a lineup.
This approach has been borrowed from other sports like football or baseball, where specialists can be extremely valuable. This is much less true in a flowing game like basketball. “Adding” a shooter to the lineup means “subtracting” another player from the floor. Whatever specialty a player is put on the floor to perform, the team gets his whole game — offense and defense. So while it’s worth analyzing what guys are good at doing, it MUST be coupled with analysis of his overall impact on the game.
From Steinberg:
“And not to try to get you into trouble, but it’s been sort of a season-long question for Wizards fans, and I’m a big one,” Sheehan said. “And that is how on board were you with sort of this space-and-pace and pace-and-space and going small?”
“Well, I didn’t have big decisions to make,” Wittman said, “because after the roster was put together with the guys that left and the additions that we had, I had nobody that could back up Marcin [Gortat] at the 5 spot. Kevin Seraphin left and I had nobody there. I thought what was best for our team was to take Nene out of the starting lineup and play him more at 5 than at 4. And that was more just because of the makeup, and we had success with it.”
Good question from Sheehan. Wittman’s answer is…interesting. I agree with his point that the roster construction left him with few lineup choices. I’m baffled by his comment about Seraphin because the big fella was terrible with the Wizards and has been even worse with the Knicks.
From Steinberg:
Wittman said he’s sympathetic with armchair coaches, because he does the same thing when he’s watching baseball or football. But he noted with some amusement that last year critics said his team was playing too big, and this year other critics say his team is playing too small. He said he would run out of minutes if he started a big lineup but then also used Nene as his second-string center, but added that a bigger lineup could be used in a shorter playoff series. And he said this year’s changes have both helped Washington’s offense and hurt its defense.
“There’s no question about it, [it] hurt our rebounding a little bit as well,” he said. “And that’s an important factor for us because we want to run. If you don’t rebound the ball, you can’t run.”
The first part of this struck me as a strawman. Statistical analysis suggested the team would be better off taking fewer two-point jump shots, and that the team could probably benefit by adding a stretch-four. That doesn’t mean “playing smaller” — at least not to me.
I disagree with Wittman that the changes are what hurt the defense. And the rebounding really hasn’t suffered much at all. Last season, the Wizards were third in defensive rebounding at 77.3%. This year, they’ve fallen to tenth, but their defensive rebounding percentage is still a robust 77.0%. More teams than ever are opting to emphasize getting back on defense rather than going for offensive rebounds.
If it’s not rebounding, what’s causing the decline in Washington’s defense? Answer: an inability to make opponents miss. Like last year, the team still does a good job keeping opponents out of the paint (fifth best at preventing opponent at-rim attempts; down from third best last year). However, opponent efficiency on at-rim and three-point attempts has improved. That could be about playing smaller lineups (taller players tend to force lower opponent shooting percentages), but it could be something else such as less effective close-outs on three-point attempts, and/or random variation.
Bottom line: bad analytics didn’t sabotage the Wizards — at least not at the coaching level. What’s hampered them this year is the reality that they have very average talent across the board.
Player Production Average
The ratings below are from a metric I developed called Player Production Average (PPA). In PPA, players are credited for things they do that help a team win, and debited for things that don’t, each in proportion to what causes teams to win and lose. PPA is pace neutral, accounts for defense, and includes an adjustment based on the level of competition faced when a player is on the floor. In PPA, average is 100, higher is better, and replacement level is 45.
League-wide PPA scores through games played 3/1/16 are here.
| PLAYER |
GMS |
MPG |
11/10 |
11/22 |
12/3 |
12/13 |
12/21 |
12/30 |
1/6 |
1/13 |
1/27 |
2/11 |
3/1 |
| Marcin Gortat |
53 |
31.0 |
91 |
112 |
128 |
133 |
132 |
138 |
147 |
145 |
148 |
151 |
172 |
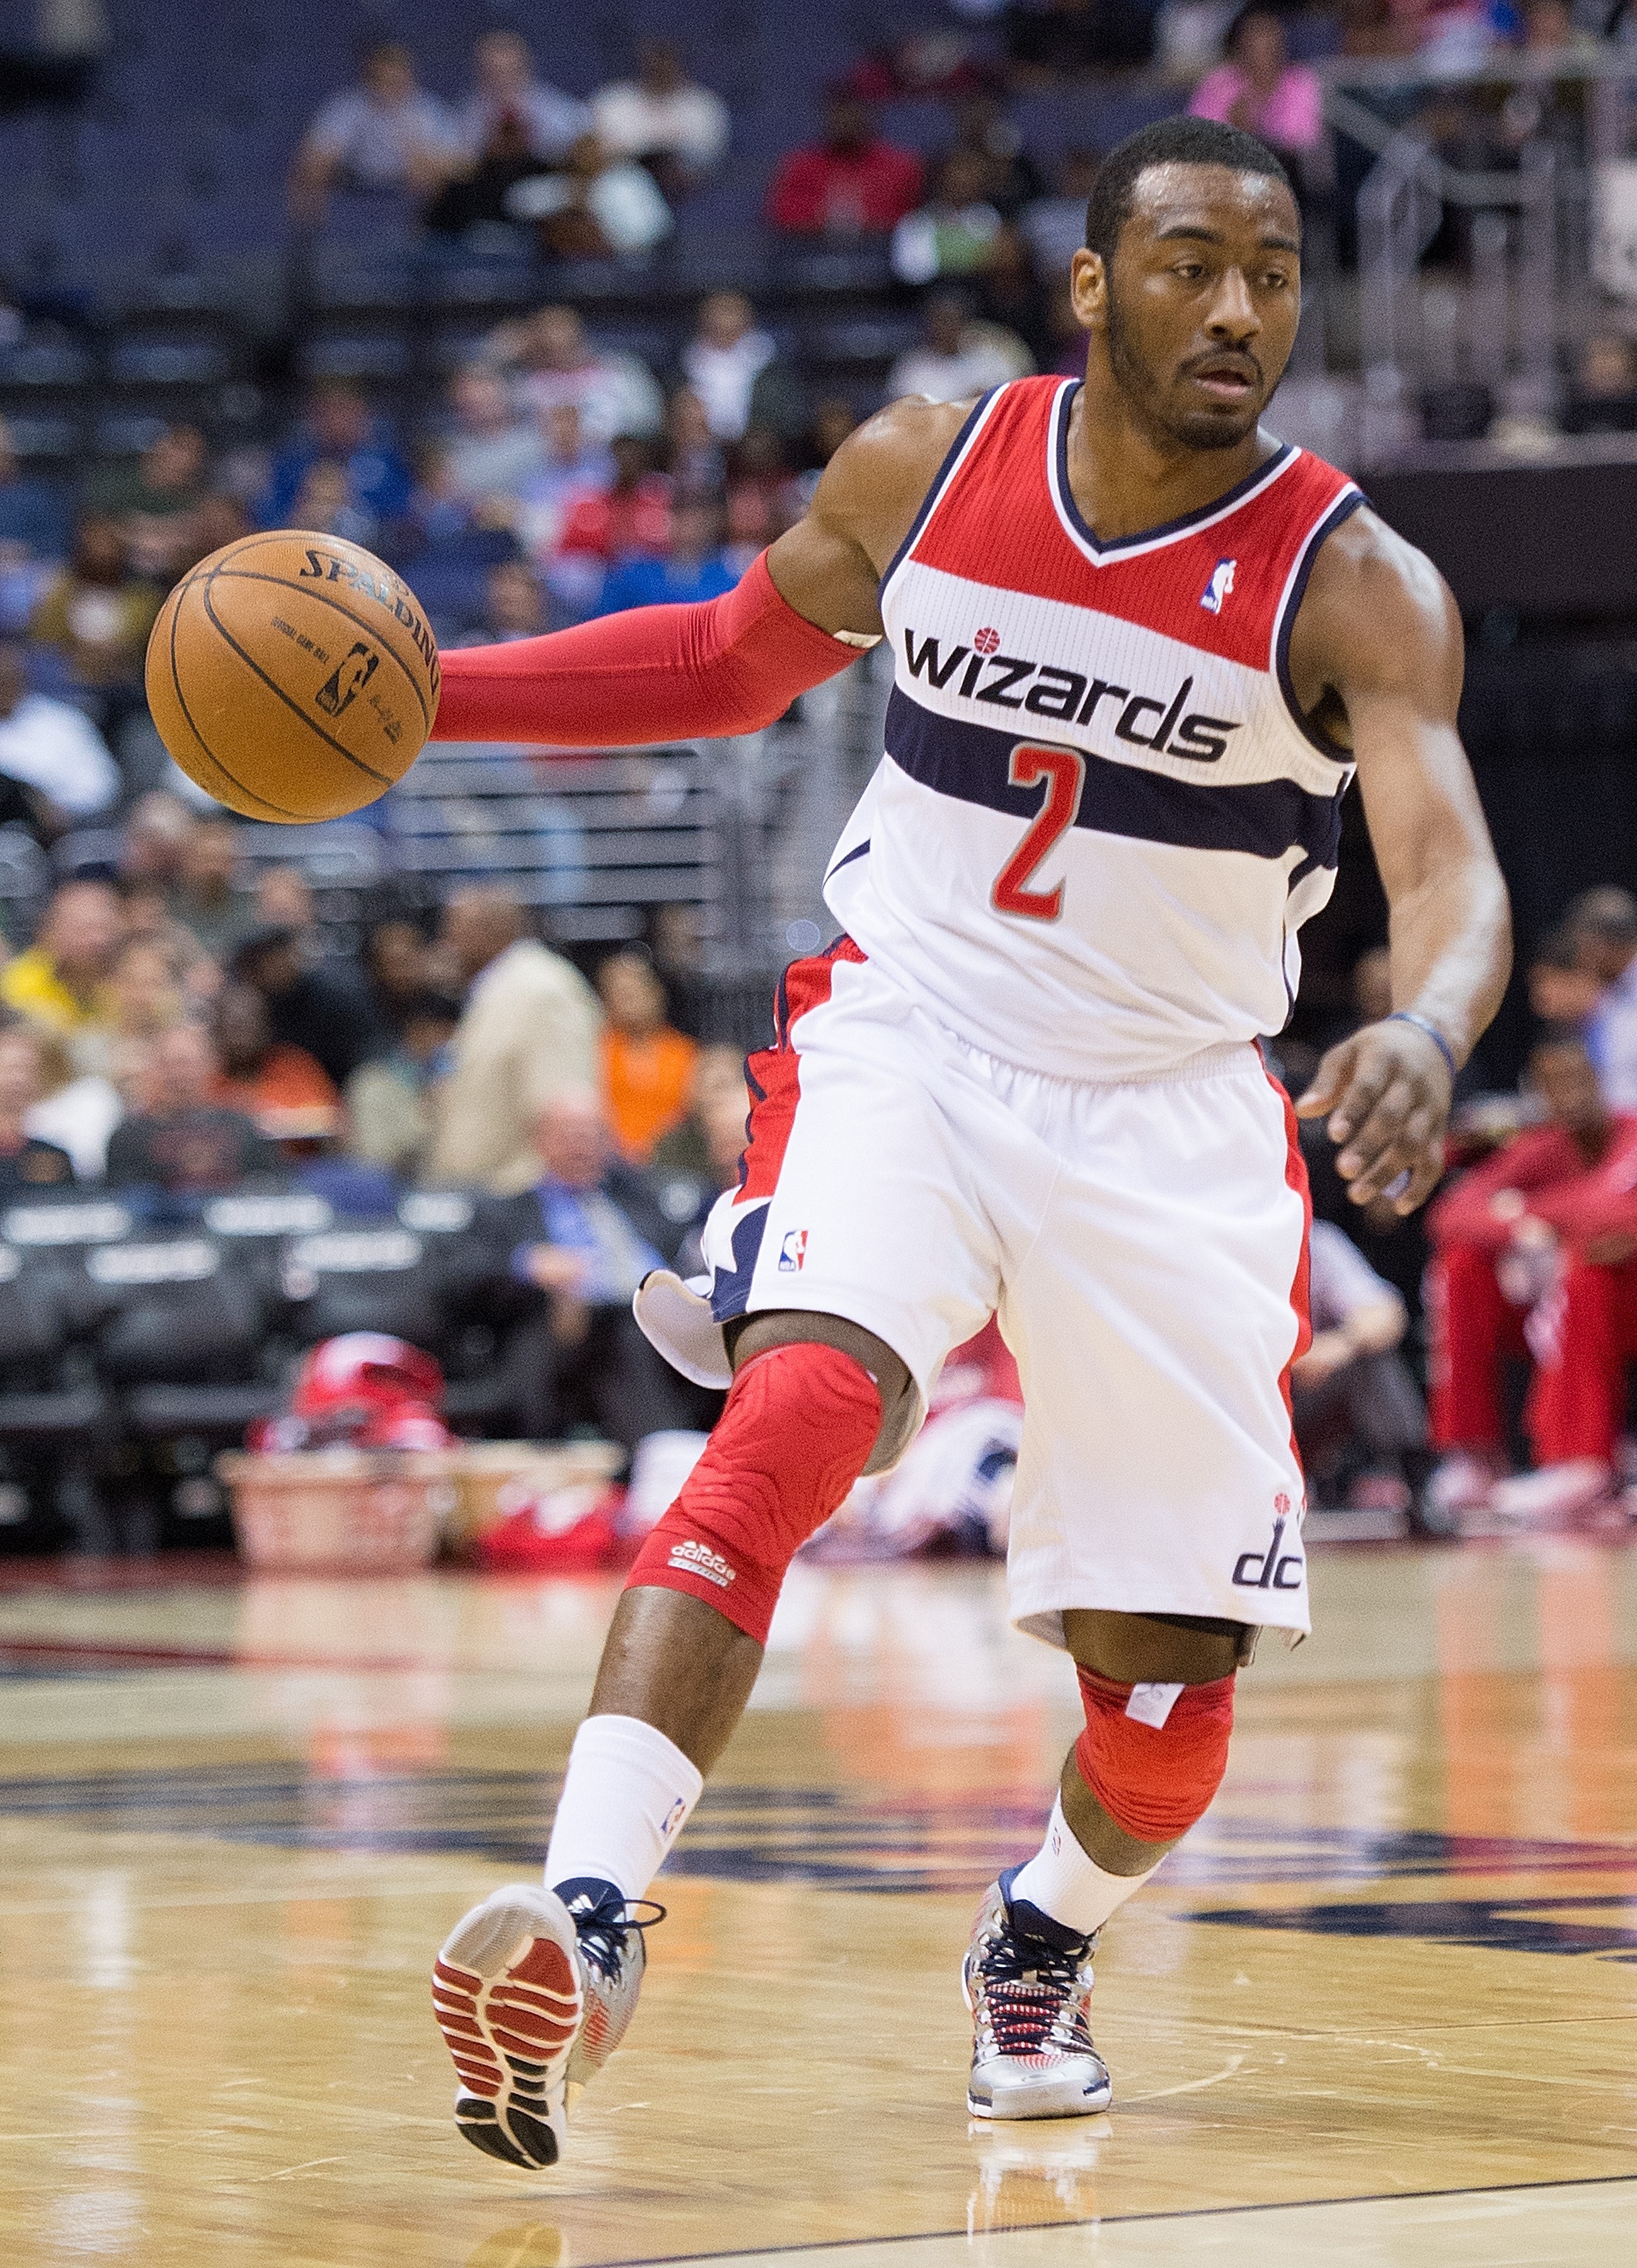
| John Wall |
59 |
35.9 |
153 |
129 |
136 |
168 |
157 |
157 |
149 |
144 |
142 |
146 |
153 |
| Otto Porter |
52 |
30.5 |
144 |
158 |
104 |
116 |
107 |
115 |
122 |
127 |
130 |
130 |
134 |
| Jared Dudley |
58 |
28.4 |
36 |
92 |
90 |
85 |
98 |
103 |
100 |
105 |
99 |
104 |
106 |
| Alan Anderson |
3 |
16.0 |
– |
– |
– |
– |
– |
– |
– |
– |
– |
– |
97 |
| Bradley Beal |
38 |
31.0 |
128 |
108 |
96 |
87 |
87 |
86 |
85 |
86 |
98 |
108 |
94 |
| Ramon Sessions |
59 |
20.4 |
131 |
119 |
84 |
90 |
87 |
89 |
88 |
91 |
90 |
89 |
88 |
| Nene Hilario |
35 |
18.7 |
58 |
90 |
80 |
74 |
79 |
78 |
79 |
88 |
92 |
84 |
86 |
| Gary Neal |
40 |
20.2 |
23 |
49 |
64 |
75 |
78 |
74 |
75 |
78 |
71 |
70 |
69 |
| Jarell Eddie |
18 |
5.0 |
– |
– |
– |
– |
– |
153 |
119 |
113 |
110 |
86 |
68 |
| Garrett Temple |
57 |
25.3 |
38 |
106 |
57 |
54 |
70 |
63 |
68 |
79 |
79 |
69 |
59 |
| Markieff Morris |
7 |
24.1 |
– |
– |
– |
– |
– |
– |
– |
– |
– |
– |
41 |
| Drew Gooden |
27 |
10.8 |
99 |
51 |
57 |
56 |
56 |
56 |
38 |
47 |
34 |
31 |
26 |
| Kelly Oubre |
48 |
11.2 |
-103 |
-4 |
-40 |
-44 |
9 |
37 |
43 |
39 |
36 |
29 |
22 |
| J.J. Hickson |
2 |
5.5 |
– |
– |
– |
– |
– |
– |
– |
– |
– |
– |
-14 |
| Kris Humphries |
28 |
16.6 |
90 |
121 |
95 |
80 |
78 |
76 |
79 |
79 |
78 |
76 |
– |
| Ryan Hollins |
5 |
9.6 |
– |
– |
-40 |
60 |
59 |
– |
– |
– |
– |
– |
– |
| DeJuan Blair |
29 |
7.5 |
-345 |
-129 |
-112 |
-45 |
-34 |
-38 |
-38 |
-28 |
-6 |
-15 |
– |
On a per minute basis, Gortat remains the Wizards’ top producer. Wall leads in total production because he plays more minutes.
Markieff Morris has had a rough start to his career in Washington, but should improve over time.