Wizards Turn To Plan B

horford

After spending two years carefully clearing cap space for an offseason in which nearly half the league would be able to have room to add a maximum salary free agency, the Washington Wizards top free agent target (Kevin Durant) declined to meet with them, forcing the team to turn to plan B.

Plan B could take a variety of forms as the front office tries to make the best of a disappointing situation. The primary options:

  1. Build the Bench: They have a theoretical starting five on the roster, and they’ve told reporters they’re happy with that group. So, the team could eschew upper-shelf free agents to focus on mid-level guys who could give the team depth.
  2. Reach for (Near) Stars — Durant being gone doesn’t mean the cupboard is bare. The team still has sufficient money to land a maximum-salary free agent, and possibly a significant role player. They’d then be left with the room exception (about $2.9 million) to fill out the bench.
  3. Wait ’til Next Year — They’ve spent the past two offseasons avoiding long-term contracts. Not even getting an at-bat with Durant, the team could opt for lather-rinse-repeat and sign players to one-year contracts. Then they could enter the 2017 free agent market with $30+ million in cap space. Of course, if they strike out with top free agents next season, then what? At some point a team has to commit to trying to build the best roster possible. Right?

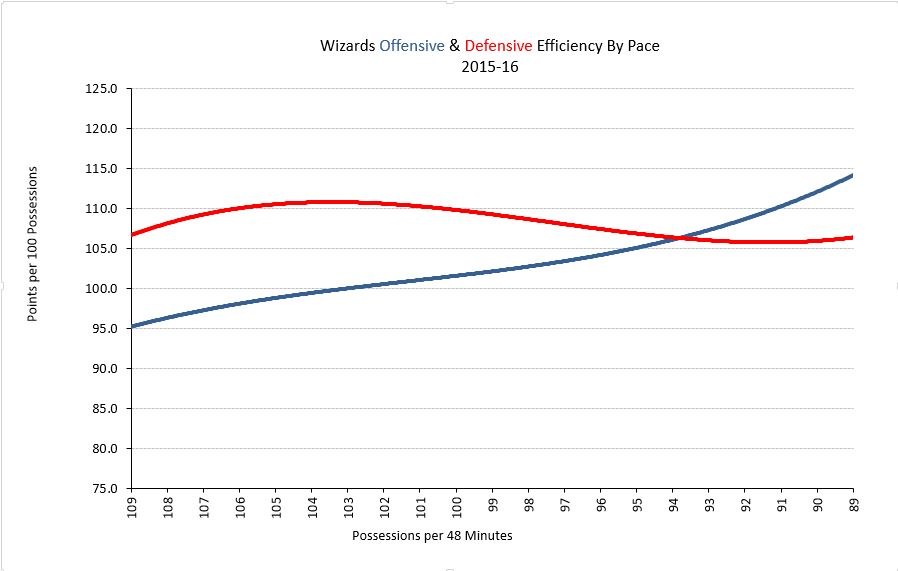
There are perils with each approach. The first seems to be the one they’re going to pursue, and it’s the least realistic way to build a contending team. Their problem this season wasn’t a bad bench or depth, it was a lack of elite talent. They could get some good luck and see significant development from Bradley Beal, Kelly Oubre, Otto Porter or John Wall, but more likely they’ll end up “contending” for the playoffs.

The other two are somewhat compatible. They could pursue an upper-level free agent, and then fall back to a Plan C of “Wait ’til Next year” if they whiff.

In my analysis, the Wizards could use upgrades in the starting lineup at shooting guard and power forward. They’ve publicly committed themselves to re-signing Beal, and have spent some time congratulating themselves on using their draft pick to acquire Markieff Morris, but those are the actual needs. Wall is a very good point guard, Marcin Gortat is a solid center, and Otto Porter is a criminally underrated small forward.

Here’s how I’d prioritize the team needs:

  • starting PF
  • starting SG
  • starting SF
  • backups at every position

So, who are some potential free agent targets? I identified some who are worth the money, likely bargains, and likely cap albatrosses over at Vice. But, here are some free agents who intrigue me for the Wizards.

  • Al Horford — the PF/C is entering his age 30 season, and I’m normally hesitant to commit significant money to players past 30. But, the bigs tend to age a little better than guards, and Horford’s game is likely to age reasonably well (as was the case for his historical comps). In my analysis, Horford has a good chance of having 2-3 All-Star level seasons. The fourth year he’s sure to get is much iffier, though. A maximum salary offer would be a very modest overpay in the first year, but it gets more reasonable with the cap surging even higher next season. In Washington, he could split time between PF and C, help lead a recommitted defense, and give the team the future option to trade Gortat to fill other positions of need.
  • Jared Sullinger — Just 23 years old, and unpopular with fans in Boston, Sullinger has nonetheless been a productive performer. Whether he stays that way without an actual commitment to physical fitness is questionable. He has offensive skills that would make him a good partner with Wall, and he rebounds well and passes superbly. Plus, he’s likely available for less than the max.
  • Nicolas Batum — I’m not as excited about Batum as others, but he’s skilled, versatile, fairly productive and should be entering his prime. He’s apparently a candidate for a maximum salary, which would be a significant overpay in my analysis. I’d still consider it because he’d be terrific in various combinations with Wall, Beal and Porter. And he’d be insurance for the oft-injured Beal.
  • Mirza Teletovic — The Wizards are reportedly ready to make a major financial offer to stretch four Ryan Anderson. I wanted them to acquire Anderson four years ago, but they traded their cap space to New Orleans for Emeka Okafor and Trevor Ariza (and New Orleans then used said cap space to acquire Anderson from Orlando). But, Anderson hurt his back and endured personal tragedy, and he hasn’t been the same player. Instead of paying $18+ million (in the first year), the Wizards could likely land Teletovic — an even more prolific long-range shooter who rebounds and defends about as poorly as Anderson — for half the money. Teletovic is past 30, but might be obtainable on a shorter contract because of it. I project Anderson adding about four wins next season; Teletovic about three. That difference isn’t worth an additional $9 million per season.
  • The Wizards are going to need a backup PG. My top two — both of whom might be available for the $2.9 million room exception — Donald Sloan and Ramon Sessions. Sloan was just about the definition of average, but he’s good passer (over 10 assists per 100 team possessions last year) and competent, albeit not prolific, three-point shooter. Sessions did a solid job backing up Wall last season, and while similar in effectiveness to Sloan, he was stylistically quite different. Where Sloan is in more of a passing PG mold; Sessions is a penetrator and scorer who makes frequent trips to the free throw line. Both guys were efficient last season. Either could be an adequate backup for Wall next year.
  • The Wizards should also strongly consider bringing back versatile forward Jared Dudley, and using him as PF or SF depending on the matchup. Dudley is probably going to be one of the biggest bargains in free agency this year. He’s a solid player who’s going to end up signing for less than his on-court production deserves.

Predicting deep-discount bargains is a big challenge because there’s so much free agent money available. For example, it’d be fun to take a flyer on Spurs big man Boban Marjanovic. He was wildly productive last season, but in 504 minutes of mostly garbage time. Could he be effective with more playing time? It’s an intriguing question, but it could be an expensive experiment given the ocean of free agent money and the thin free agent talent.

Some possible bargains, according to my Diamond Rating (a metric that attempts to identify players who were productive in limited playing time that might perform well in an expanded role)…

  • Boban Marjanovic, San Antonio
  • Cole Aldrich, LA Clippers
  • Festus Ezeli, Golden State
  • Quincy Acy, Sacramento
  • Dwight Powell, Dallas

You may have noticed those are all big men. The backcourt free agent group looks pretty thin in my analysis. The best “bargain” candidate is Seth Curry, who performed well in just 725 minutes for the Kings. Another intriguing name is Indiana’s Solomon Hill, who might be a tweener without a position, but might also be a small-ball PF.

All this written, I can’t say I’m optimistic about the Wizards and free agency. The Ernie Grunfeld-led front office has shown a propensity for suboptimal moves. My guess is they’ll land Ryan Anderson, and then seek to fill out the bench with veterans. I don’t expect them to pursue the lather-rinse-repeat strategy and try to roll cap space into next offseason. There’s internal pressure to make the playoffs, and I anticipate low-risk moves designed to achieve that modest goal.

Advertisement

Those Disappointing Wizards

wittman confused

The surest way to get disappointed is to start with unrealistically high expectations. For exhibit gazillion, I present the 2015-16 Washington Wizards.

During the preseason, there was a fascinating disconnect between fans, media observers, and my statistical analysis. Many, including some of my stat pals at APBRmetrics thought the Wizards would be pretty good. The team seemed to fit a familiar narrative — they’d been bad, they’d gotten a taste of the playoffs (and even won a first round series) in 2013-14, and then had been better yet in 2014-15 (complete with a first round sweep of the Toronto Raptors). Fueled by All-Star John Wall and his young backcourt buddy Bradley Beal, the Wizards would take the next step and become Eastern Conference Contenders.

Over on the message board at RealGM, 76 members predicted the team’s final record. The average prediction: 48.0 wins. (Strictly speaking, 77 members made a prediction. I’m removing my own because it fits into a different category). A helpful soul compiled nine media predictions (strictly speaking, it was eight plus a betting service’s over/under line; also there are ten predictions listed, but 538’s belongs in a different category), which were only slightly less optimistic: 46.6 wins.

Roll all of those up, and it’s 85 predictions ranging from a high of 56 to a low of 37. The group pick: 47.9 wins.

The APBRmetrics crowd was less optimistic — average prediction: 44.8 wins.

My stat-based model predicted 41.4 wins, but I rounded up to 42 in my preseason analysis at Vice. The guys at 538.com predicted 41 wins.

What’s gone wrong? Nothing unexpected, really. Wall’s been maybe a little less productive than anticipated, but he’s quite close to my preseason prediction. Beal hasn’t been as good as I’d predicted — and he got hurt more than I’d expected — but that’s counterbalanced by Marcin Gortat and Otto Porter being healthier and more productive than projected.

So, was it injuries that doomed the Wizards? No. While the Wizards are near the league lead in games missed due to injury, most of the games were missed by bottom of the rotation guys — Alan Anderson, Drew Gooden, Gary Neal. Yes, Nenê and Beal missed their usual allotment. But among players who were on the roster since preseason, they’re fourth and sixth in per possession production. Washington’s three most productive players per possession (Wall, Gortat and Porter) have missed a total of 13 games.

There’s another whopping problem with the “injuries done ’em in” narrative: it’s hopelessly one-sided. For example, when I ran an estimate during the All-Star break on how many additional games the Wizards might have won at full health, I looked only at the Wizards. To do this analysis properly, however, it’s nonsensical to ignore injuries suffered by other teams.

Not having time today for a complete analysis of my own, I turn to ManGamesLost.com. That site lists the Wizards as having the third most games missed due to injury this season. They have two measures of the effect those injuries have had on the team. The Wizards rank 21st in one, and 19th in the other. In other words, injuries have cost Washington LESS in the win column than the average NBA team.

To put it more simply: the injury excuse is bullshit.

So what went wrong? Again, nothing surprising. Most of the players performed to reasonable preseason expectations. The team had been very average in preceding seasons, and several teams in the East improved while the Wizards tried to maintain their averageness.

The reason the Wizards are so disappointing is that fans and media (and apparently the players) set about constructing a narrative of a surging franchise. Unfortunately, the foundation for that narrative consisted of inflated win totals in a historically weak conference, and a massive overestimation of the importance of first round playoff wins.

Keep in mind that the playoffs represent tiny sample sizes. Last season’s postseason lasted 10 games. Washington’s record: 6-4. The previous season, it was 11 games. Their record: 6-5. At any other time in a season, such a performance would be expected for an average team. When it happens in the playoffs, it becomes a portent, an omen. And there’s a dose of that curious one-sidedness when it comes to injuries.

Many said (repeatedly) something to the effect of: “The Wizards might have beat the Hawks if only Wall hadn’t hurt his hand.” Acknowledged far less often is the reality that Washington’s first-round sweep of Toronto was helped by a serious back injury that hobbled Raptors star Kyle Lowry. If we’re going to imagine “what if” scenarios for a full-health Wizards against Atlanta, we also ought to recognize they might not have gotten out of the first round against a full-health Raptors squad.

With five games to go, the Wizards have a slim (about 2%) chance of reaching the postseason. All they need do is win out while Detroit loses three of their remaining four. But, as they limp toward the lottery (with the pick likely going to Phoenix), the team still embodies what I wrote in the preseason: it’s a mediocre roster that lacks an elite producer.

Player Production Average

The ratings below are from a metric I developed called Player Production Average (PPA). In PPA, players are credited for things they do that help a team win, and debited for things that don’t, each in proportion to what causes teams to win and lose. PPA is pace neutral, accounts for defense, and includes an adjustment based on the level of competition faced when a player is on the floor. In PPA, average is 100, higher is better, and replacement level is 45.

League-wide PPA scores through games played 04/05/16 are here.

PLAYER GMS MPG 11/10 11/22 12/3 12/13 12/21 12/30 1/6 1/13 1/27 2/11 3/1 3/14 4/5
Marcin Gortat 71 30.3 91 112 128 133 132 138 147 145 148 151 172 169 171
John Wall 77 36.2 153 129 136 168 157 157 149 144 142 146 153 148 145
Otto Porter 70 30.8 144 158 104 116 107 115 122 127 130 130 134 126 131
J.J. Hickson 11 7.4  –  –  –  –  –  –  –  –  –  – -14 96 108
Markieff Morris 24 26.2  –  –  –  –  –  –  –  –  –  – 41 58 95
Bradley Beal 52 31.3 128 108 96 87 87 86 85 86 98 108 94 94 95
Jared Dudley 76 26.1 36 92 90 85 98 103 100 105 99 104 106 98 89
Nene Hilario 53 19.1 58 90 80 74 79 78 79 88 92 84 86 90 82
Ramon Sessions 77 19.6 131 119 84 90 87 89 88 91 90 89 88 85 76
Alan Anderson 9 14.4  –  –  –  –  –  –  –  –  –  – 97 90 68
Marcus Thornton 11 12.3  –  –  –  –  –  –  –  –  –  –  – -6 65
Garrett Temple 75 24.6 38 106 57 54 70 63 68 79 79 69 59 56 57
Jarell Eddie 22 4.5  –  –  –  –  – 153 119 113 110 86 68 51 55
Kelly Oubre 59 9.8 -103 -4 -40 -44 9 37 43 39 36 29 22 25 27
Drew Gooden 28 10.6 99 51 57 56 56 56 38 47 34 31 26 22 22
DeJuan Blair 29 7.5 -345 -129 -112 -45 -34 -38 -38 -28 -6 -15  –  –  –
Gary Neal 40 20.2 23 49 64 75 78 74 75 78 71 70 69  –  –
Kris Humphries 28 16.6 90 121 95 80 78 76 79 79 78 76  –  –  –
Ryan Hollins 5 9.6  –  – -40 60 59  –  –  –  –  –  –  –  –

Good news: Gortat and Porter continue to play well. Leaving aside the issue of the crummy trade that acquired him, Markieff Morris has been solid after his first four games with the team.

Bad news: Wall remains significantly below the game’s elite performers, Beal continues to rate a bit below average, and key role players (Jared Dudley, Ramon Sessions and Nenê) have all seen production slip over the past few weeks.

In the “puzzling” category goes Randy Wittman’s playing time decisions. The team’s top lineup with more than 100 minutes this season has been Wall-Beal-Porter-Morris-Gortat. Their second best lineup is exactly the same except with Dudley instead of Morris. The second lineup has been together for precisely zero minutes over the past month.

Also puzzling has been the benching of Dudley, who has been a solid player for them throughout the season. Dudley seems ideal as a league average caliber player who gets around 24 minutes per game divided between SF and PF. The Wizards started him at PF much of the season, and have now slashed his minutes from 27.0 minutes per game through the first 72 games to just 14.0 over the last five — 4.5 minutes per game fewer than Garrett Temple.

The Surprising Problem for the Wizards

wall frustrated

One of The Official Narratives of the 2015-16 Washington Wizards season is that point guard John Wall is terrific, but is getting sideswiped by a substandard supporting cast. Last month, The Washington Post’s Dan Steinberg lamented that, “The saddest thing here is that the Wizards might be in the process of sacrificing a year of John Wall’s prime.”

In Michael Lee’s excellent article at Yahoo!, Wall echoed Steinberg, saying: “I ain’t trying to waste a season.

Adam McGinnis and I touched on the subject during our podcast last week.

Alas, as is the case with many Official Narratives, there are problems.

  1. On a per-possession basis, Wall isn’t Washington’s most productive player. That honor goes to center Marcin Gortat. Because Wall plays five more minutes per game than Gortat, Wall leads the team in total production.
  2. Wall is not an elite player.
  3. The overall production difference between Wall (Washington’s top producer) and Gortat (second in total production) has been vastly overstated.
  4. The quality of Wall’s “supporting cast” isn’t bad.

Wall’s PPA (see below) is 148 this year. Among players with at least 500 minutes this season, he ranks 54th. Among point guards, he ranks 11th. Wall has had stretches of dominant play, but his performance continues to be plagued by the same bugaboos he’s had throughout his career: turnovers, poor shot selection and poor shooting. Gortat, by the way, ranks 29th in PPA.

Wall isn’t an elite player. For the past few seasons seasons (including this one, most of the year), he’s rated as a top 8-10 point guard and a top 40-50 player overall. That’s very good, but well short of the impact from elite point guards and elite players. He could be great — he was in December, for example. But his performance game-to-game is a mix of fantastic and horrible. Which averages out to very good, not elite.

The average PPA of top total producers for each team is 179 — 31 points better than Wall. Among those top 30 producers, Wall ranks 24th in per possession production — ahead of Carmelo Anthony, Rajon Rondo, Nerlens Noel, Gordon Hayward, Tyson Chandler and Jordan Clarkson.

The average top producer has provided 22.0% of his team’s production. Wall is about average at 21.8%.

The average gap between a top producer and his team’s “number two” is about 4.5%. For Wall and Gortat, it’s 2.7%. Want a player who actually fits The Official Narrative? Try New Orleans where Anthony Davis has a PPA of 189, provides 26.3% of his team’s production, and (at 13.2%) sports the biggest drop to his team’s second most productive.

Since you’re wondering, the top five in total production shares:

  1. Stephen Curry, GSW — 29.6%
  2. Russell Westbrook, OKC — 26.7%
  3. James Harden, HOU — 26.4%
  4. Lebron James, CLE — 26.3%
  5. Anthony Davis, NOP — 26.3%

And, here’s the top five in drop-off to “number two”:

  1. Anthony Davis, NOP — 13.2%
  2. Stephen Curry, GSW — 12.7%
  3. James Harden, HOU — 8.5%
  4. Kawhi Leonard, SAS — 8.3%
  5. Kyle Lowry, TOR — 8.2%

Wall and the Wizards are 20th.

That’s all fine, you might be saying, but The Official Narrative isn’t necessarily that Wall’s “Robin” sucks, it’s that the roster lacks depth. That lack of depth means Wall has to carry a heavier load than other franchise leaders. Unfortunately, this is also wrong.

For this question, I calculated minutes-weighted PPA (mwPPA) for each team — after deducting the production of its top player. mwPPA provides a handy way of measuring the relative quality of each team’s roster.

The league average “supporting cast” posted an mwPPA of 92. The Wizards rank 14th so far this season with a 93. Since you were wondering, here’s the top five in supporting cast mwPPA:

  1. SAS — 124
  2. GSW — 121
  3. ATL — 107
  4. OKC — 105
  5. BOS — 104

So, to recap:

  • Wall isn’t elite.
  • The gap between Wall’s total production and Gortat’s is smaller than average for a number one to a number two.
  • The Wizards “supporting cast” is mediocre, not terrible.

The real problem for the Wizards is in that first bullet. Their problem: they don’t have an elite player.

Player Production Average

The ratings below are from a metric I developed called Player Production Average (PPA). In PPA, players are credited for things they do that help a team win, and debited for things that don’t, each in proportion to what causes teams to win and lose. PPA is pace neutral, accounts for defense, and includes an adjustment based on the level of competition faced when a player is on the floor. In PPA, average is 100, higher is better, and replacement level is 45.

League-wide PPA scores through games played 3/14/16 are here.

PLAYER GMS MPG 11/10 11/22 12/3 12/13 12/21 12/30 1/6 1/13 1/27 2/11 3/1 3/14
Marcin Gortat 60 30.2 91 112 128 133 132 138 147 145 148 151 172 169
John Wall 66 35.9 153 129 136 168 157 157 149 144 142 146 153 148
Otto Porter 59 30.1 144 158 104 116 107 115 122 127 130 130 134 126
Jared Dudley 65 27.7 36 92 90 85 98 103 100 105 99 104 106 98
J.J. Hickson 6 7.5  –  –  –  –  –  –  –  –  –  – -14 96
Bradley Beal 42 30.6 128 108 96 87 87 86 85 86 98 108 94 94
Nene Hilario 42 18.8 58 90 80 74 79 78 79 88 92 84 86 90
Alan Anderson 8 14.0  –  –  –  –  –  –  –  –  –  – 97 90
Ramon Sessions 66 20.3 131 119 84 90 87 89 88 91 90 89 88 85
Markieff Morris 14 26.0  –  –  –  –  –  –  –  –  –  – 41 58
Garrett Temple 64 25.4 38 106 57 54 70 63 68 79 79 69 59 56
Jarell Eddie 21 4.7  –  –  –  –  – 153 119 113 110 86 68 51
Kelly Oubre 53 10.7 -103 -4 -40 -44 9 37 43 39 36 29 22 25
Drew Gooden 28 10.6 99 51 57 56 56 56 38 47 34 31 26 22
Marcus Thornton 3 15.0  –  –  –  –  –  –  –  –  –  –  – -6
Ryan Hollins 5 9.6  –  – -40 60 59  –  –  –  –  –  –  –
Kris Humphries 28 16.6 90 121 95 80 78 76 79 79 78 76  –  –
Gary Neal 40 20.2 23 49 64 75 78 74 75 78 71 70 69  69
DeJuan Blair 29 7.5 -345 -129 -112 -45 -34 -38 -38 -28 -6 -15  –  –

Reality vs. the Wizards

The Wizards are not going to make the playoffs this year. They’re not quite as good as they’ve been the past couple years, which is to say they’re a bit worse than mediocre.

Wizards fans — and perhaps the Wizards themselves — are hanging their dreams of postseason participation on some fragile hooks:

  1. the schedule gets easier, and
  2. key Wizards players have returned from injury.

Neither factor holds as much promise for the Wizards as adherents might imagine. The schedule does get easier, but the Wizards are five games below .500 because they’ve played below average basketball through their first 51 games, not because the schedule was difficult.

Before the All-Star break, Washington’s opponents were 0.67 points per game better than average. That’s the approximate quality of a 43-win team over an 82-game schedule. Against this very slightly better than average level of competition, the Wizards got outscored by 2.7 points per game. Which means Washington performed about two points per game worse than average.

The schedule does get easier. Opponents the rest of the way have been a point per game worse than average the rest of the way — about the quality of a 38-win team over an 82-game schedule. In other words, the Wizards are going from playing the approximate quality of an eighth or ninth place team to playing opponents the approximate quality of a ninth or tenth place team.

There are a couple problems, though. First, the Wizards have been worse by a point per game than the aggregate of their remaining opponents. And second, 17 of their remaining games are on the road, and the post All-Star break sprint starts with three games in three nights.

Run the numbers on their remaining schedule, and at this point they’d be the favorite in 11 of their remaining 31 games. If you believe (as I do) the real quality of the team is about average, they’ll probably win between 14 and 17 games the rest of the way – meaning they’d finish with 37 to 40 wins, and would miss the playoffs.

So what about the injuries? The Wizards have indeed lost the NBA’s highest number of player games to injury so far this season. Unfortunately, the players who missed games weren’t the team’s major producers of wins, and their replacements did a reasonable job filling in.

Prior to the All-Star break, I used PPA to quantify how much injuries cost the team. That involved reapportioning minutes (taking playing time from Garrett Temple, Gary Neal and others, and assigning it to players who missed time like Bradley Beal, Nenê, and others). Based on the performance levels of the players involved, I estimate the team would have won two additional games with perfect health.

Two wins is a significant number, but it wouldn’t change the overall trajectory of the season. Washington would be 25-26 – closer to eighth in the East, but still in ninth or tenth place. Even with an easier schedule the rest of the way, the numbers in this “ideal health” scenario would project the Wizards to finish with 41 to 42 wins, and a likely ninth place finish.

Washington still has a theoretical chance to finish eighth. Chicago and Charlotte have suffered injuries — Jimmy Butler’s being far more damaging to the Bulls than Michael Kidd-Gilchrist’s to the Hornets. But, the eighth seed in the East is going to need a minimum of 42 wins, and to do even that well, the Wizards would need to transmogrify from playing like a 37-win team to playing like a 50-win team.

Here’s a simple table showing the task the Wizards have created for themselves. It’s not impossible for them to make the playoffs, but it is highly improbable. The W82 column shows the quality level the Wizards would need to reach the target wins. So, to reach 44 wins this season, they’d need to finish 21-10, which is the approximate level of a 56-win team over an 82-game schedule.

TARGET   NEED   W82
W L W L
44 38 21 10 56
43 39 20 11 53
42 40 19 12 50

Player Production Average

The ratings below are from a metric I developed called Player Production Average (PPA). In PPA, players are credited for things they do that help a team win, and debited for things that don’t, each in proportion to what causes teams to win and lose. PPA is pace neutral, accounts for defense, and includes an adjustment based on the level of competition faced when a player is on the floor. In PPA, average is 100, higher is better, and replacement level is 45.

League-wide PPA scores through games played 2/11/16 are here.

PLAYER GMS MPG 11/10 11/22 12/3 12/13 12/21 12/30 1/6 1/13 1/27 2/11
Marcin Gortat 45 31.2 91 112 128 133 132 138 147 145 148 151
John Wall 51 36.1 153 129 136 168 157 157 149 144 142 146
Otto Porter 44 31.0 144 158 104 116 107 115 122 127 130 130
Bradley Beal 30 31.8 128 108 96 87 87 86 85 86 98 108
Jared Dudley 50 28.9 36 92 90 85 98 103 100 105 99 104
Ramon Sessions 51 20.4 131 119 84 90 87 89 88 91 90 89
Jarell Eddie 14 5.6  –  –  –  –  – 153 119 113 110 86
Nene Hilario 28 18.8 58 90 80 74 79 78 79 88 92 84
Kris Humphries 28 16.6 90 121 95 80 78 76 79 79 78 76
Gary Neal 40 20.2 23 49 64 75 78 74 75 78 71 70
Garrett Temple 49 25.6 38 106 57 54 70 63 68 79 79 69
Drew Gooden 22 12.4 99 51 57 56 56 56 38 47 34 31
Kelly Oubre 43 11.9 -103 -4 -40 -44 9 37 43 39 36 29
DeJuan Blair 29 7.5 -345 -129 -112 -45 -34 -38 -38 -28 -6 -15
Ryan Hollins 5 9.6  –  – -40 60 59  –  –  –  –  –

Beal has returned from injury playing well. Wall, Gortat and Porter continue to lead the team in production. The numbers indicate the Wizards actually have some decent professional players. What they lack is an elite producer. More on that coming tomorrow.

Wizards Update: Level Best

It may seem strange to worry about the Wizards making the playoffs this season when they still have 49 games to play, but history suggests they’re already running out of time to turn things around and reach the postseason.

It’s likely going to take 45 wins to earn the eighth seed in this year’s East. With Washington at 15-18, simple math says they’ll need another 30 wins in their final 49 games. That means playing at about .600 level the rest of the way — basically at the level of a 50-win team (over an 82-game schedule).

This is possible and not unprecedented in basketball history. Teams have dramatically improved after a poor start. But not many of them. Teams that started a season like the Wizards were much more likely to remain at the same level than markedly improve. One of those teams (the 04-05 Denver Nuggets) made two coaching changes and played .800 ball (32-8) to finish the season with 49 wins. That record is a dreamworld best-case fantasy, though.

In the real world, last season’s Wizards actually began the year a 31-18 record in their first 49 games. That’s a .633 winning percentage, and if they could replicate it over the final 49 games of this season they’d end up with 46 wins and a berth in the playoffs. Last year in reverse has a patina of plausibility, which makes it seem more possible than the evidence indicates.

Unfortunately, there are several good reasons to think that quality of play is unlikely. Since that 31-18 start, the Wizards are 36-40 — 15-18 to finish 2014-15, 6-4 in the playoffs, and 15-18 this season. That’s the quality of a 37-win team across a BIG stretch (93% of a regular season). And it’s notably consistent.

In addition, the team’s scoring differential through that 49-game stretch suggested they weren’t quite as good as their record. Scoring differential analysis indicated a 28-win team during that stretch — about the level of a 46-win team over an 82-game schedule, not the 51-win level suggested by their 31-18 record. At 33 games last season, the team was 22-11 — about three wins ahead of their expected win total. The difference wasn’t an indication that the Wizards “knew how to win” or had become “clutch,” it was a signal that the team wasn’t as good as their record.

And here’s where things get even more worrisome for the 2015-16 edition of the Wizards: their scoring differential says they’re the quality of a 13-win team through their first 33 games. Their won/loss record is running about two games ahead of their expected wins. This is a sign of weakness. Widely perceived as under-performing, the team is actually playing even worse than their already bad record. Their winning percentage is that of a 37-win team over an 82-game schedule. Their scoring differential suggests they’re playing at the level of a 32-win team. Another way of looking at it: they’re 19th in winning percentage, and 22nd in scoring differential.

The task ahead of them is not impossible. They could improve, and they are just 2.5 games from the eighth seed. But it’s time for some urgency. It’s time for them to start playing at a higher level and to string together wins. Because with every additional loss, the goal of making the playoffs this season becomes less and less probable.

Player Production Average

The ratings below are a metric I developed called Player Production Average (PPA). In PPA, players are credited for things they do that help a team win, and debited for things that don’t, each in proportion to what causes teams to win and lose. PPA is pace neutral, accounts for defense, and includes an adjustment based on the level of competition faced when a player is on the floor. In PPA, average is 100, higher is better, and replacement level is 45.

League-wide PPA scores through games played 01/06/16 are here.

PLAYER GAMES MPG 11/10 11/22 12/3 12/13 12/21 12/30 PPA
John Wall 33 35.7 153 129 136 168 157 157 149
Marcin Gortat 30 31.2 91 112 128 133 132 138 147
Otto Porter 30 32.2 144 158 104 116 107 115 122
Jarell Eddie 5 11.6 153 119
Jared Dudley 32 27.8 36 92 90 85 98 103 100
Ramon Sessions 33 21.3 131 119 84 90 87 89 88
Bradley Beal 17 36.5 128 108 96 87 87 86 85
Kris Humphries 27 17.1 90 121 95 80 78 76 79
Nene Hilario 13 17.0 58 90 80 74 79 78 79
Gary Neal 25 22.1 23 49 64 75 78 74 75
Garrett Temple 31 22.8 38 106 57 54 70 63 68
Ryan Hollins 5 9.6     -40 60 59 59 59
Kelly Oubre 26 13.4 -103 -4 -40 -44 9 37 43
Drew Gooden 7 11.6 99 51 57 56 56 56 38
DeJuan Blair 18 8.4 -345 -129 -112 -45 -34 -38 -38

Wall’s season has been…odd. He was mediocre through the first month of the season, posting a PPA of just 94. When the calendar shifted to December, he abruptly transmogrified into an All-NBA caliber point guard, posting a December PPA of 202. Then in January, he’s posted three straight crummy games, and has a PPA of just 86. His wildly vacillating performance level gives ample ammunition to fans who believe he should be starting the All-Star game (look at the sensational play in December), as well as those who think other players are more deserving (look at the bad first month of the year). In PPA, he’s a borderline All-Star candidate — fifth among guards in the East (minimum 750 minutes), but with frontcourt players rated ahead of him.

Wizards Update: Mediocrity, Naturally

Sports fandom involves some cognitive bias. We assign importance to patterns without real meaning, see signs in events that are essentially random. We hope for the best and steadfastly convince ourselves this is the time things finally work out for the good guys. Long-time Wizards fans are experts at this kind of thing. Our brains are wired for it.

For example, the Wizards won four games in a row before falling to the Clippers and Raptors. Winning streaks are usually interpreted as a sign that a team is good. They’re finding their groove, hitting their stride, getting a rhythm. Right?

Well, no, actually. Long streaks, like Golden State’s (or Philadelphia’s) to start the season provide meaningful information about the relative quality of those teams. But, for virtually every NBA team, including a  mediocre one like the Wizards, three- and four-game streaks are inevitable. According to the handy table in Dean Oliver’s 2004 book, Basketball On Paper, a team that wins half its games during an 82-game season has a 99.4% chance of winning four in a row at some point. Naturally, that .500 team has the same odds of losing four in a row. By their 28th game, the Wizards had accomplished both, plus an independent three-game winning streak.

A .400 team — one that would win about 33 games — has an 87% chance of winning at least four in a row during an 82-game season. Even a 25-win team has nearly a 50% chance of at least one four-game winning streak.

Sometimes randomness is fun, like Rasual Butler’s hot streak last season, or Gary Neal’s this year, or Garrett Temple’s binge of three straight games with at least 20 points. Other times, it’s not so fun, like Butler’s second half of the season, or any of Neal’s “non-hot” games, or the dud performances Temple produced in the games preceding and following the scoring outburst.

This is not meant to be a nihilistic “everything is random and therefore meaningless” screed. Some teams and players are better than others. But, the true quality of a team is found by what they do on average, over time.

The Wizards in recent years have been decidedly, consistently, mediocre. I can hear the arguing already: 46 wins last season; 44 wins the year before; trips to the second round of the playoffs both years. These are signs of the Wizards being a team on the rise that’s hoarding cap space for a run at a superstar, and they’ve had some bad luck with injuries this season. Maybe. But, more likely: fan-think.

In an 82-game season, how many games would a truly mediocre team win? The easy answer is 41. That’s exactly half, right in the middle. Therefore, 46 wins is five better than average, which means the Wizards were better than average. This isn’t wrong — just incomplete.

Let’s imagine a team that’s perfectly mediocre in quality. By the end of an 82-game season, it will score exactly as many points as its opponent. How many games will this mediocre team win? They might win 41, but they might win a few more or a few less. Their win total depends on how those points get distributed. Having a 50% chance of winning each individual game doesn’t mean a team will actually win half the games.

For a simple randomness test, google up a coin-flipping simulator or flip a coin yourself. Just for kicks, I ran a coin-flip simulator on 11 sets of 82 trials, one set of 66 trials, and one set of 30 trials. Astute readers might notice the number of “trials” matches the number of regular season games the Wizards have played since Ernie Grunfeld became president.

Of the 998 trials, heads came up 516 times — 51.8% of the time. Variance, right off the bat. If “heads” equals “wins” (and it does here because it’s my blog), that works out to about 42.5 “wins” per 82 games.

Here are the “win” results from each set of the 82 coin-flip trials:

  1. 47
  2. 48
  3. 39
  4. 46
  5. 37
  6. 35
  7. 38
  8. 36
  9. 42
  10. 44
  11. 53

In other words, in a random test where each independent coin flip has identical odds of producing a win or a loss, there’s a low of 35 wins and a high of 53. For the heck of it, I ran the simulation again and got a cumulative “winning percentage” of .454 with a high of 43 and a low of 34. Remember: this is totally random. A perfectly mediocre team could see its actual win total vary significantly from .500.

Which brings me back to the Wizards. There are a few good measures of relative team strength besides record. Chief among these are scoring differential, and efficiency differential, which are basically the same thing, and those same measures adjusted by strength of schedule.

Those differential numbers (adjusted for strength of schedule or not) can be used to estimate how many games each team would be expected to win. Last season, for example, the Wizards’ scoring differential suggested a team that would win 42-43 games. Winning 46 felt good, but was probably more about random outcomes for a mediocre team. The playoff “runs” were hella fun to watch, but represent a small sample size that’s even more prone to random variation. In other words, us fans (and maybe folks in the league as well) overrate results from the first round of playoffs.

Let’s go back to Team Perfectly Mediocre, and let’s say they’ve met their match in the first round of the playoffs. We’ll call the opponent: the Toronto Raptors. Who’s going to win this festival of random mediocrity? It might be a closely-matched, 4-3 series, but maybe not. I replicated 10 seven-game series for Team Mediocre vs. the Raptors, and the “series” went seven games three times, and six games three times. It also had three consecutive “sweeps” and one five-game series. Remember: this is totally random.

Back to the Wizards. Since Grunfeld took over Washington’s basketball operations before the 2003-04 season, the team has been meaningfully worse than mediocre, even allowing for randomness. Under Grunfeld’s leadership — now in its 13th season — Washington has won 417 out of 998 regular season games. That’s a winning percentage of .418. Just to see, I ran the “perfectly mediocre” test of Grunfeld’s 998-game (so far) term with the Wizards 10,000 times and couldn’t come up with a variance close to Washington’s actual performance. This is a fancy way of saying the Wizards have been truly bad under Grunfeld.

Over the course of his 12 full seasons, the Wizards have compiled a record of .500 or better six times, but have managed a positive scoring margin just three times. Grunfeld’s teams in Washington have averaged 34.3 wins per 82 games — slightly outpacing the 33.9 predicted by scoring differential and the 33.3 predicted by adjusted scoring differential.

If the 998 games represented a single, massively long basketball contest, the Wizards have been outscored by 2,467 points with Grunfeld at the helm.

Player Production Average

The ratings below are a metric I developed called Player Production Average (PPA). In PPA, players are credited for things they do that help a team win, and debited for things that don’t, each in proportion to what causes teams to win and lose. PPA is pace neutral, accounts for defense, and includes an adjustment based on the level of competition faced when a player is on the floor. In PPA, average is 100, higher is better, and replacement level is 45.

League-wide PPA scores through games played 12/30/15 are here.

PLAYER GAMES MPG 11/10 11/22 12/3 12/13 12/21 PPA
John Wall 30 35.5 153 129 136 168 157 157
Jarell Eddie 3 12.7 153
Marcin Gortat 27 31.2 91 112 128 133 132 138
Otto Porter 27 32.0 144 158 104 116 107 115
Jared Dudley 29 27.4 36 92 90 85 98 103
Ramon Sessions 30 21.0 131 119 84 90 87 89
Bradley Beal 17 36.5 128 108 96 87 87 86
Nene Hilario 12 17.4 58 90 80 74 79 78
Kris Humphries 25 17.5 90 121 95 80 78 76
Gary Neal 24 22.1 23 49 64 75 78 74
Garrett Temple 28 21.5 38 106 57 54 70 63
Ryan Hollins 5 9.6     -40 60 59 59
Drew Gooden 6 12.8 99 51 57 56 56 56
Kelly Oubre 23 12.7 -103 -4 -40 -44 9 37
DeJuan Blair 18 8.4 -345 -129 -112 -45 -34 -38

The basic message in the numbers: Wall and Gortat need help. The Wizards don’t have starter-quality players at power forward, shooting guard or (arguably) small forward. Wall remains in the good-not-great range; Gortat’s production is still solid, but diminished significantly from last season.

The other basic message: Wall and Gortat need help fast. Teams in the East have improved, and it’s probably going to take 44-45 wins to make the playoffs. The Wizards are on pace for 38. To reach 45 wins, they’ll need to go 31-21 over their remaining games — about the pace of a 49-win team. Theoretically possible, but not very likely. Barring a major turnaround, the conversation about the Wizards in April won’t be about their matchup in the playoffs, but about their odds of getting the top pick in the draft lottery.

Wizards Update: Just the Numbers

four

As Dean Oliver first wrote, there are four key factors that determine who wins and loses in the NBA. In order of importance: shooting, rebounding, getting to the free throw line and turnovers. So far this season, the data suggests that variation in efg differential accounts for about 44% of variation in scoring differential; rebounding accounts for 26%, getting to the free throw line about 18%, and turnovers about 11%.

How are the Wizards doing? They’re 25th in efg differential, 24th in rebounding differential, 9th in turnover differential and 10th in free throw differential. All that combines to rank 23rd in average scoring margin, which means they haven’t played even as well as their 19th ranked winning percentage might suggest.

At this point, Basketball-Reference forecasts the Wizards to win about 36 games and indicates the team’s odds of winning the draft lottery (2.5%) are about the same as them making the playoffs this season (2.4%).

While the team embarked on an effort to play faster, the results through 25 games indicates they may still benefit by slowing down. The defense appears to be largely unaffected by pace, but the numbers suggest the team may be a bit more efficient in slower-paced games. The effect is small, but at this point the team needs every advantage it can get.

rtg by pace

Player Production Average

The ratings below are a metric I developed called Player Production Average (PPA). In PPA, players are credited for things they do that help a team win, and debited for things that don’t, each in proportion to what causes teams to win and lose. PPA is pace neutral, accounts for defense, and includes an adjustment based on the level of competition faced when a player is on the floor. In PPA, average is 100, higher is better, and replacement level is 45.

League-wide PPA scores through games played 12/20/15 are here.

PLAYER GAMES MPG 11/10 11/22 12/3 12/13 PPA
John Wall 25 35.1 153 129 136 168 157
Marcin Gortat 22 30.2 91 112 128 133 132
Otto Porter 24 32.3 144 158 104 116 107
Jared Dudley 24 26.9 36 92 90 85 98
Ramon Sessions 25 19.7 131 119 84 90 87
Bradley Beal 17 36.5 128 108 96 87 87
Nene Hilario 12 17.4 58 90 80 74 79
Gary Neal 23 22.4 23 49 64 75 78
Kris Humphries 20 18.1 90 121 95 80 78
Garrett Temple 23 18.0 38 106 57 54 70
Ryan Hollins 5 9.6 -40 60 59
Drew Gooden 6 12.8 99 51 57 56 56
Kelly Oubre 18 9.3 -103 -4 -40 -44 9
DeJuan Blair 14 9.5 -345 -129 -112 -45 -34

As I’ve been writing seemingly for years now, the Wizards continue to lack elite production. Click over to the full league numbers and you’ll find 11 players with at least 500 minutes who have a PPA of at least 200. Wall ranks 10th among point guards, but in a virtual tie with Reggie Jackson and Rajon Rondo.

This isn’t Wall’s “fault” exactly, he’s a very good player. But he needs more help than he’s getting. Beal ranks 24th among shooting guards, Porter 16th among small forwards, Gortat 18th among centers, and Dudley 31st among power forwards.

Wizards Update: A Silver Lining

As if the 2015-16 Wizards season wasn’t crummy enough, the team released news over the weekend that Bradley Beal would miss at least a couple weeks with yet another stress reaction in his leg. While this was a bummer of a development — especially when combined with Beal’s fourth consecutive season of pedestrian production — I’m writing today not to induce depression, but to give hope.

Wizards point guard John Wall began the season well: after a strong performance against the Spurs, Wall’s PPA (see below) sat at a heady 184 — not an MVP candidate, but probably in the conversation for All-NBA, and definitely All-Star level.

And then, for some reason (possibly a previously undisclosed ankle injury) his production tanked. After four consecutive good-to-great games to start the year, eight of his next ten games rated below average in PPA. In two of the games (at Boston and home against Toronto), Wall rated a net negative; a scary place for the team’s star. After posting a -70 vs. the Raptors, Wall’s PPA for the season stood at a slightly below average 96.

And then…the calendar switched to December and Wall abruptly began playing like an MVP candidate. In the eight games since that -70, Wall has produced a PPA of 300 or better four times, and another three better than 200. His lone dud was a 74 against Phoenix.

Wall’s PPA for October and November was 96. In December: 278. For context, here are the top five full-season PPA scores on record:

  1. Lebron James, MIA, 2012-13 — 282
  2. Stephen Curry, GSW, 2014-15 — 277
  3. Lebron James, CLE, 2008-09 — 275
  4. Michael Jordan, CHI, 1990-91 — 268
  5. Lebron James, CLE, 2009-10 — 267

Now, even posting a 278 the rest of the way won’t get Wall into this year’s MVP conversation because Curry’s PPA is another 70 points better, but still. Wall has been playing great the past couple weeks, and seems to be turning his season around. That’s a genuine reason for optimism.

Player Production Average

The ratings below are a metric I developed called Player Production Average (PPA). In PPA, players are credited for things they do that help a team win, and debited for things that don’t, each in proportion to what causes teams to win and lose. PPA is pace neutral, accounts for defense, and includes an adjustment based on the level of competition faced when a player is on the floor. In PPA, average is 100, higher is better, and replacement level is 45.

League-wide PPA scores through games played 12/03/15 are here.

PLAYER GAMES MPG 11/10 11/22 12/3 PPA
John Wall 22 35.0 153 129 136 168
Marcin Gortat 19 29.6 91 112 128 133
Otto Porter 22 33.0 144 158 104 116
Ramon Sessions 22 19.0 131 119 84 90
Bradley Beal 17 36.5 128 108 96 87
Jared Dudley 21 26.5 36 92 90 85
Kris Humphries 17 17.6 90 121 95 80
Gary Neal 20 22.0 23 49 64 75
Nene Hilario 12 17.4 58 90 80 74
Ryan Hollins 5 9.6 -40 60
Drew Gooden 6 12.8 99 51 57 56
Garrett Temple 20 17.6 38 106 57 54
Kelly Oubre 15 6.9 -103 -4 -40 -44
DeJuan Blair 12 8.5 -345 -129 -112 -45

If I could have one Christmas present for the Wizards, it’d be a starting quality power forward.

Wizards Update: The Everyone Problem

worried wall

Good thing for the Wizards that the NBA season is long because if it ended today, they’d be out of the playoffs and looking at a 2.8% chance of getting Ben Simmons in the 2016 draft.

Washington is just 7-9 with a scoring differential (weighted for strength of schedule) that ranks 23rd — more than a point per game below 22nd ranked Sacramento. This isn’t what fans (or many analysts) expected after the team escaped the first round of the playoffs each of the past two seasons. Washington was supposed to be an Eastern Conference contender, an echelon below Cleveland, but still a force to be reckoned with.

Not so much.

Leaving aside the issue of whether those expectations were realistic, what’s wrong? Lots. As Dean Oliver wrote, there are four key factors that determine winning and losing in basketball: shooting from the floor (efg), turnovers, rebounding, and free throws. Shooting is the most important of these, and the Wizards are tied for 18th in shooting from the floor. They’re second worst at controlling the ball. They’re 27th in offensive rebounding. They get to the free throw line frequently (sixth best), but overall they rank 28th thus far in offensive efficiency.

The situation isn’t much better on defense. They’re 22nd in defensive efg, average in defensive rebounding, and do a good job of forcing turnovers and keeping opponents off the free throw line. But, making the other team miss is the decisive factor: they rank 20th in defense.

Who’s at fault? Everyone, really.

The front office assembled a roster without a starter-quality power forward. While they made a good trade for Jared Dudley (solid player in exchange for nothing), he’s a small forward they’re asking to masquerade as a stretch four. He can get by in the S4 role off the bench, but his lack of rebounding (low career numbers even for a SF), size and athleticism gets exposed against starters. Kris Humphries is a backup; Drew Gooden a bench-warmer; Nenê is aging and injured.

The team obviously established a goal of preserving cap space for free agents in 2016, but wasted short-term signings on Gary Neal, Alan Anderson and Ryan Hollins.

So, put “front office” at the top of the “at fault” list — even without diving down the rabbit hole of botched draft picks and free agent acquisitions in previous years.

Next up: the coaching staff. This season, the team’s braintrust decided to enter basketball modernity by cutting back on two-point jump shots and taking more threes. This shift should have helped the offense run more efficiently even with the team shooting slightly worse from three-point range, but Randy Wittman and company confounded the issue by coupling changed shot selection with playing faster.

The problem: playing faster has nothing to do with playing better. Smart coaching emphasizes strategies that improve efficiency. Swapping two-point jumpers for threes, at-rim attempts and free throws is smart. Playing faster because it’s fashionable is not. (Especially when analysis of the team the past few years suggests the Wizards may have been better in slower-paced games.)

There’s room on the “blame bus” for the players, and rightfully so — virtually everyone who wears the Wizards uniform is under-performing. The only players with a PPA (see below) higher than last year are Otto Porter and Gary Neal, and Porter’s production has cratered since a promising start.

Despite back-to-back outstanding games (vs. Cleveland and the Lakers), John Wall’s PPA is 15 points lower than last season. Marcin Gortat’s production is down 42 points. Bradley Beal is “about the same” (down three points in PPA), but now in his fourth season still rates just average.

Kris Humphries, Jared Dudley, Ramon Sessions, Nenê, Drew Gooden, and Garrett Temple are all performing worse so far this season. All are showing double-digit drops in PPA.

For crissake, even DeJuan Blair, coming off the worst season of his career, is performing worse.

While they don’t belong on the “blame bus,” the Eastern Conference gets some credit for Washington’s poor start. Last season, a stat goober whose name I can’t remember (please take/give credit where it’s due if you read this and know who I’m talking about) estimated that top five teams in the East gained about three wins in 2014-15 because of the sorry state of the conference. This year, several Eastern teams improved while the Wizards attempted to be about the same.

How can the Wizards get better?

  1. De-emphasize pace. Stop worrying about trying to be like Golden State, and play at a pace that makes sense for the roster currently in place. Change the emphasis to valuing possessions and getting good shots, and look for offensive efficiency to rise.
  2. Get Wall and Gortat back to normal. Both are established veterans with production levels significantly better than what they’ve done thus far. It’s hard to believe they’re going to continue playing this poorly.
  3. Get improvement from Beal and/or Porter. Unfortunately, Beal continues to show improvement. He’s much the same player (in terms of overall impact) as he was in his rookie year. Porter started the season well, but has struggled since as teams developed a scouting report. Now it’s time for Porter to come up with ways to produce anyway.
  4. Make a trade. They don’t have a starter-quality PF on the roster.

The season is still young and the Wizards are probably going to start playing better. But, that’s what the Nationals kept saying, and then they ran out of games and the story of their 2015 season was they just weren’t good enough. For the Wizards, there’s an added concern because they need to be good enough to persuade a prominent free agent to join the young core.

Player Production Average

The ratings below are a metric I developed called Player Production Average (PPA). In PPA, players are credited for things they do that help a team win, and debited for things that don’t, each in proportion to what causes teams to win and lose. PPA is pace neutral, accounts for defense, and includes an adjustment based on the level of competition faced when a player is on the floor. In PPA, average is 100, higher is better, and replacement level is 45.

League-wide PPA scores through games played 12/03/15 are here.

PLAYER GAMES MPG 11/10 11/22 PPA
John Wall 16 33.7 153 129 136
Marcin Gortat 16 28.9 91 112 128
Otto Porter 16 32.1 144 158 104
Bradley Beal 13 35.5 128 108 96
Kris Humphries 16 17.6 90 121 95
Jared Dudley 15 24.7 36 92 90
Ramon Sessions 16 17.8 131 119 84
Nene Hilario 12 17.4 58 90 80
Gary Neal 14 19.6 23 49 64
Drew Gooden 6 12.8 99 51 57
Garrett Temple 14 15.8 38 106 57
Ryan Hollins 1 11.0     -40
Kelly Oubre 11 7.5 -103 -4 -40
DeJuan Blair 6 8.5 -345 -129 -112

Wizards Update: Porter Leading The Way

otto porter

I have to say I’m pretty torn on the Wizards so far. On one hand, they’re 6-4 despite injuries to Bradley Beal, Alan Anderson and Martell Webster, as well as growing pains as they figure out how their personnel can mesh with their new Pace & Space offense.

Sticking with the positives: Otto Porter is having a terrific season (leads the team in PPA — see below), and they’re getting some decent play Ramon Sessions, Nenê and Jared Dudley off the bench.

On the other hand…John Wall — despite his publicly stated desire to be an MVP candidate this season — is performing like a pretty average starter, the team seems to crumble whenever Kris Humphries is on the floor (despite decent production from Humphries), and Marcin Gortat is lost on offense.

Since I believe Wall and Gortat will perform more like they did last season, my biggest area of concern is at power forward. Humphries continues to be fairly productive, and has even added a three-point shot. So far this season, he’s at .412. An analysis I did in July suggested .365 could be anticipated.

The problem: the Wizards collapse when he’s out there. So far, Washington is 5.2 points per 100 possessions worse offensively and 5.9 points per 100 possessions worse defensively (net -11.1 points per 100 possessions) when Humphries is out there. While the results are a bit extreme because of the small sample size, keep in mind the Wizards were worse on both ends of the floor with Humphries last season, and Boston was worse on offense with him out there.

My theory: Humphries plays like my iPhone 4 trying to load an app. When it’s time for business (like catching a pass), there’s a pause, then a blank screen, then a spinning wheel, and then maybe some action. It could be that Humphries is just better against reserves than starters.

Unfortunately, the Wizards don’t really have a viable option to start at power forward. Nenê can’t be relied on in that role, and moving him into the starting lineup leaves the team without a reserve center. I’m dubious about Jared Dudley as a viable option — he’s been a below-average rebounder for a SMALL forward throughout his career. (It’s worth mentioning that in the tiny sample size recorded thus far, Dudley is rebounding at his best rate since his rookie year.)

If the team can’t figure out how to play with Humphries as a starter, they may be forced to start Dudley and take some lumps on the board.

Player Production Average

The ratings below are a metric I developed called Player Production Average (PPA). In PPA, players are credited for things they do that help a team win, and debited for things that don’t, each in proportion to what causes teams to win and lose. PPA is pace neutral, accounts for defense, and includes an adjustment based on the level of competition faced when a player is on the floor. In PPA, average is 100, higher is better, and replacement level is 45.

League-wide PPA scores through games played 11/22/15 are here.


PLAYER GAMES MPG 11/10 PPA
Otto Porter 10 32.9 144 158
John Wall 10 32.7 153 129
Kris Humphries 10 20.8 90 121
Ramon Sessions 10 18.0 131 119
Marcin Gortat 10 27.5 91 112
Bradley Beal 7 33.9 128 108
Garrett Temple 8 15.4 38 106
Jared Dudley 9 21.7 36 92
Nene Hilario 9 18.6 58 90
Drew Gooden 6 12.8 99 51
Gary Neal 10 18.7 23 49
Kelly Oubre 6 10.0 -103 -4
DeJuan Blair 4 8.5 -345 -129