Projection: Wizards Will Win 45 and Return to the Playoffs

Improvement from the Washington Wizards youngsters, and an infusion of frontcourt depth will be offset by missed time due to injuries and declines from the team’s older players to keep the team in the middle of the NBA pack for another year. However, the team could be a dangerous playoffs matchup if they’re able to enter the postseason healthy.

Below, I’m offering up projections done a couple different ways. The first is built on the similarity scores I’ve posted after the past week. This approach finds players in NBA history with similar production at a similar age, and then looks at what they did in subsequent seasons. Those findings are then applied to the Wizards roster and combined with a playing time estimate for each player.

For this estimate (and the other one, which I’ll get to later in this post), I’ve used my overall metric Player Production Average (PPA), which is calibrated to explain individual player contributions to winning and losing. PPA is pace neutral, accounts for defense, and includes a “degree of difficulty” factor based on the level of competition a player faces while on the court. In PPA, 100 = average, higher is better, and 45 = replacement level.

Statistical Doppelganger Projection

POS PLAYER MIN LAST SEASON PPA PROJECTED PPA PROJECTED kWins
PG John Wall 2812 139 156 9.0
C Marcin Gortat 2464 154 132 6.7
SG Bradley Beal 2325 96 112 6.1
SF Paul Pierce 1800 139 108 4.0
SF Otto Porter 1800 15 85 3.2
PF Kris Humprhies 1608 132 133 4.4
F/C DeJuan Blair 1450 97 97 2.9
PF Nenê 1430 102 90 2.7
PG Andre Miller 1165 86 65 1.6
G/F Glen Rice Jr. 1029 20 78 1.2
F/C Drew Gooden 1002 106 100 2.1
G/F Martell Webster 1000 77 74 1.5
POS TEAM 19885 107 110 45.4

MIN = projected TOTAL minutes for the upcoming season

Projected kWins = how many wins that player will contribute based on his projected PPA and projected total minutes.

Over the past few seasons, the Wizards’ front office has converted the team from being one of the league’s youngest to being one of the league’s oldest. Gortat, Nenê, Pierce, Gooden and Miller all figure to play prominent roles this season, and all are past 30. Well past 30 for Pierce and Miller.

Projections for Porter and Rice were difficult because they played so little last season. For both, I elected to throw out their rookie numbers and rely instead on projections based on the rookie seasons of the players they were most like from college. Using the rookie numbers would lower Porter’s projected PPA to 66 and Rice’s to 30. That would drop Washington’s projected win total 43.8.

Note that I didn’t include Kevin Seraphin, Garrett Temple or Rasual Butler in the above table. They’ll get some minutes along the way, but — barring several catastrophic injuries — none should see enough court time to have a major effect on the team’s fortunes. For those interested, this is what I project for the end-of-the-bench trio:

  • Garrett Temple: 33
  • Kevin Seraphin: 49
  • Rasual Butler: 55

I can hear the cockeyed optimists already: “Why do you just assume the old guys will get worse? What if they maintain for a year?” Quick answer (and one I’ve given before): athletes past 30 tend to two things — get hurt and get worse.

But, let’s say the “Ancients” are able to do this season what they did last year. In that event, Washington’s projected win total would climb to 48.5. Which would be hella fun.

On the other hand, there are scenarios where there are more injuries than expected, younger players don’t make anticipated improvements and/or older players decline more steeply. That gives a potential “bottom” of 40.7 wins.

Simple Rating System Projection

POS PLAYER MIN LAST SEASON PPA SRS PROJECTED PPA PROJECTED kWins
PG John Wall 2812 139 143 8.3
C Marcin Gortat 2464 154 144 7.3
SG Bradley Beal 2325 96 111 5.3
SF Paul Pierce 1800 139 117 4.3
SF Otto Porter 1800 15 63 2.3
PF Kris Humphries 1608 132 133 4.4
F/C DeJuan Blair 1450 97 135 4.0
PF Nene Hilario 1430 102 102 3.0
PG Andre Miller 1165 86 108 2.6
G/F Glen Rice 1029 20 82 1.7
F/C Drew Gooden 1002 106 118 2.4
G/F Martell Webster 1000 77 102 2.1
G/F Rasual Butler 0 63 81 0.0
C Kevin Seraphin 0 35 53 0.0
G Garrett Temple 0 24 54 0.0
POS TEAM 19885 107 117 47.9

The guys over at Basketball-Reference have up Simple Rating System projected stats for everyone who played in the NBA last season. Go here for an explanation. They don’t estimate minutes, which I can understand because it’s frigging hard to do.

The SRS approach is more optimistic than the one I used — at least at the bottom line. SRS generally predicts less of a decline for older players, but also not as much improvement from the younger ones. The SRS approach would suggest the Wizards will win 48 games this season — with a low end prediction of 43 and a high of 52.

Here’s a table comparing results from the two approaches:

POS PLAYER DOPP PPA SRS PPA DOPP kWINS SRS kWINS
PG John Wall 156 143 9.0 8.3
C Marcin Gortat 132 144 6.7 7.3
SG Bradley Beal 112 111 6.1 5.3
SF Paul Pierce 108 117 4.0 4.3
SF Otto Porter 85 63 3.2 2.3
PF Kris Humprhies 133 133 4.4 4.4
F/C DeJuan Blair 97 135 2.9 4.0
PF Nenê 90 102 2.7 3.0
PG Andre Miller 65 108 1.6 2.6
G/F Glen Rice Jr. 78 82 1.2 1.7
F/C Drew Gooden 100 118 2.1 2.4
G/F Martell Webster 74 102 1.5 2.1
G/F Rasual Butler 55 81 0.0 0.0
C Kevin Seraphin 49 53 0.0 0.0
G Garrett Temple 33 54 0.0 0.0

DOPP PPA = projected PPA using the Statistical Doppelganger approach

SRS PPA = projected PPA using the Simple Rating System numbers published by Basketball-Reference

DOPP kWINS = projected individual wins contributed using the Statistical Doppelganger approach

SRS kWINS = projected individual wins contributed using the Simple Rating System numbers published by Basketball-Reference

Final Word

In the end, I’m using my own projection system. Last year, I projected the Wizards would win 43 — they won 44, albeit not exactly in ways that I expected. I’ve refined my projection system (I hope), although I’m hoping the team outperforms my prediction by a wide margin.

While still lacking an elite producer, the Wizards could be a tough out in the playoffs when rotations shorten and there’s more rest between games (especially in the first round). If they can get there healthy, of course.

I’m projecting the Wizards will win between 41 and 48 games this season. Final projection: 45 wins and the fifth seed in the Eastern Conference playoffs.

A Quick Look At Something (Hopefully) Devoid of Meaning

otto porter

The Wizards exhibition season has ended and they’re hopefully in the training rooms and rehabilitation gizmos trying to get healthy for their regular season opener against the Heat next Wednesday.

What does the preseason mean? Roland Beech, then proprietor of 82games.com (and now working for the Dallas Mavericks) ran some correlations a few years back. His findings suggest that preseason provides some indication of a team’s regular season fortunes, but that the previous season’s winning percentage remains a better barometer.

Beech’s numbers showed the preseason matters most to teams who stunk the previous year. The strongest correlations between preseason record and regular season record were between teams that won 30 or fewer games the previous year. Second strongest were for teams winning 40 to 49 games (hello, Wizards).

The Wizards, of course, are going to be on the “preseason doesn’t matter” side of this discussion considering they were 11th in the Eastern Conference in preseason efficiency differential and 29th in offensive efficiency. The league scored 101.8 points per 100 possessions in the preseason; the Wizards scored 95.0.

On the bright side, Washington boasted the league’s 8th best defensive rating.

Below are the preseason estimated Player Production Averages (PPA) for Wizards who played at least 50 minutes. PPA is an overall rating metric I developed that credits players for things they do that help a team win, and debits them for things that don’t. It’s a per-minute stat that’s pace-neutral, (normally) accounts for defense, and (normally) includes a “degree of difficulty” factor based on the level of competition a player faces while on the floor. In PPA, 100 = average, higher is better, and (normally) 45 = replacement level.

I use “normally” in a few spots because the data necessary to calculate a player’s defensive contributions and/or the degree of difficulty factor aren’t available in the preseason. Plus, I don’t know if there can be such a thing as “replacement level” in the preseason.

PLAYER GMS MPG ePPA
james,damion 5 12.6 188
silas,xavier 3 17.7 145
porter,otto 7 26.6 110
miller,andre 6 18.3 96
temple,garrett 7 19.7 91
hilario,nene 5 19.4 90
wall,john 6 25.8 82
gortat,marcin 7 27.4 71
pierce,paul 5 19.6 51
seraphin,kevin 7 21.9 52
rice,glen 4 22.3 46
butler,rasual 5 15.6 32
blair,dejuan 7 21.3 -3
beal,bradley 3 20.7 -38

Do NOT use these numbers to make bold predictions or sweeping pronouncements. These represent a tiny sample size — a sample in which many players are basically going through the motions at least some of the time — and are presented just as a general barometer for how players performed in the preseason.

Looking back at last year’s preseason numbers and see that Bradley Beal had an outstanding preseason, but wasn’t as good in the regular season. Meanwhile, Trevor Ariza and John Wall were bad in exhibition games, but good in real ones. Some guys were about the same in both — Jan Vesely, Al Harrington, Eric Maynor, Kevin Seraphin and Garrett Temple.

This year…most of the team’s rotation players were unproductive. Wall had an ePPA below 20 most of the preseason until he had a good performance against the Knicks. Seraphin may yet have that breakout season so many are hoping for, but ended his preseason in the same general territory where he’s spent most of his young career.

The team’s bright spot in the preseason was Otto Porter. He was a little above average — encouraging progress from a second year player who was mostly overwhelmed as a rookie.

Now…real games.

Wizards Doppelgangers: The Young Backcourt

wall and beal

At this point in NBA history, there aren’t many “original” players. Today’s players are like players who have come before — in production, if not look and style. “This guy reminds me of…” is a game scouts and fans play, often to the point of absurdity.

Following in the footsteps of basketball statistical analysts like MikeG and Kevin Pelton, I’ve created a Statistical Doppelganger machine of my own. The Machine compares players across 14 categories, including age, minutes, box score stats and my own overall rating metric Player Production Average (PPA). Then, it combines those differences and…voila…players with the smallest differences leap to the top of the list — similar production at similar age.

The Machine uses pace-adjusted per-minute stats, but does not consider attributes such as height, weight or position.

I’ll post results for Wizards players leading up to the season. These “most similar” lists ultimately work their way into my projection for the team’s record this season, which I’ll publish closer to the season opener.

First up through the Statistical Doppelganger Machine: PG John Wall.

PLAYER POS SEASON AGE TEAM SIM SCORE PPA SEASON PPA PEAK
John Wall PG 2013-14 23 WAS 100 139 139
Kemba Walker PG 2012-13 22 CHA 89 131 131
Tony Parker PG 2004-05 22 SAS 89 136 187
Steve Francis PG 1999-00 22 HOU 89 133 172
Baron Davis PG 2005-06 26 GSW 89 132 163
Kenny Anderson PG 1993-94 23 NJN 89 129 161
Stephon Marbury PG 1998-99 21 MIN 89 130 164
Isiah Thomas* PG 1987-88 26 DET 88 130 181
Brandon Roy SG 2007-08 23 POR 88 143 189
Robert Pack PG 1995-96 26 WSB 88 143 143
Kenny Anderson PG 1994-95 24 NJN 88 135 161

While Wall’s overall production the past two seasons was flat (he posted a PPA of 139 in both seasons), his statistical similars is a good group for the most part. The average peak PPA for this group is 163, with Brandon Roy and Tony Parker at the high end and Kemba Walker (who’s still extremely young himself) and Robert Pack at the low.

Note the presence of Hall of Fame PG Isiah Thomas, as well as several dynamic performers like Steve Francis, Baron Davis and Stephon Marbury. And keep in mind that while Marbury ended up as The Official Selfish Player of the NBA, he was a first-rate talent who was highly productive.

For those who might be worried by seeing the names of Kenny Anderson and Robert Pack, well…stop it. Anderson was a good player, but didn’t possess anything like Wall’s elite athleticism. Plus, Anderson’s performance drop-off wasn’t really until he’d reached his thirties — and more than 23,000 career minutes. Wall isn’t even halfway there yet.

Pack was a not bad player when he could stay healthy, which really didn’t happen once he became a starter. In his best season, he managed to appear in just 31 games. Wall played more games than that in his third season, when he missed the first 33 games with a stress injury in his knee. In his four-year career, Wall has played every possible game for the Wizards twice.

While I’m not giving away my projection for Wall (yet), these comps suggest good things. I expect Wall to improve this season, and to peak at an All-NBA level in the next few years.

Next up, Bradley Beal.

PLAYER POS SEASON AGE TEAM SIM SCORE PPA SEASON PPA PEAK
Bradley Beal SG 2013-14 20 WAS 100 96 96
Brandon Jennings PG 2010-11 21 MIL 90 108 140
Brandon Jennings PG 2009-10 20 MIL 89 95 140
Mike Miller SF 2001-02 21 ORL 89 106 140
O.J. Mayo G 2008-09 21 MEM 89 81 96
Jason Richardson SF 2002-03 22 GSW 88 91 157
Quentin Richardson SG 2003-04 23 LAC 88 97 123
Michael Finley SF 1996-97 23 DAL 88 94 138
Calbert Cheaney SG 1994-95 23 WSB 88 88 88
Jamal Crawford SG 2003-04 23 CHI 88 107 113
Dennis Scott SF 1992-93 24 ORL 87 89 141

While I’m a big believe in Beal, I was not thrilled by this group of similars. Brandon Jennings? Twice? Really? OJ Mayo? Calbert Cheaney? Blech.

If you want to throw out one of those seasons from Jennings, be my guest. Next on the list was Klay Thompson last season, Eric Gordon, and then a season from Mahmoud Abdul-Rauf. None of whom significantly change the analysis.

There’s nothing particularly wrong with this group, except…none of them are Ray Allen or James Harden, or players of that caliber.

For the most part, though, this isn’t a particularly impressive group. The average peak PPA is 128, which is about the level of an average starter. Only Jason Richardson from this list peaked at a level that typically earns a spot on the All-Star team. What’s kinda interesting is that there are “repeaters” on Beal’s rookie and second year lists.

Players showing up as similar in both seasons include:

  • Mike Miller
  • Jason Richardson
  • Dennis Scott
  • Michael Finley.

Again, not a bad group…just not as strong a list as I’d have hoped. Still, Beal is young and seems to have the work ethic to improve. My gut says his ceiling is higher than what the numbers are saying…but that could just be the fan talking.

Next up: The Old Bigs — Marcin Gortat and Nenê.

Wizards 2014 Playoffs Wrap-Up

NBA Washington Wizards vs Chicago Bulls Play-Offs Game 4
Trevor Ariza dominated in the playoffs despite low-blow karate chop from Mike Dunleavy.

Just in time for the start of training camp, here’s a look back at the Wizards run in the playoffs this year. For those with short memories, Washington beat the Bulls in round one, and lost to the Pacers in round two. It was a good couple weeks for a franchise that’s been among the league’s worst the past several years.

I’ve finally gotten around to crunching the data to produce the Player Production Average (PPA) numbers. PPA is an overall rating metric I developed that credits players for things they do that help a team win, and debits them for things that don’t. It’s a per-minute stat that’s pace-neutral, accounts for defense, and includes a “degree of difficulty” factor based on the level of competition a player faces while on the floor. In PPA, 100 = average, higher is better, and 45 = replacement level.

Like any stat extracted from a small sample size, there’s a grain of salt factor. For example, Bradley Beal led the team with 458 playoff minutes — the cut when I look at regular season numbers is usually 500 minutes. Only 21 players reached 500 or more playoff minutes this year. That said, here are the numbers:

PLAYER GMS MPG RS PPA PS PPA
Trevor Ariza 11 37.0 145 193
Marcin Gortat 11 34.7 154 148
Bradley Beal 11 41.6 96 139
John Wall 11 38.2 139 82
Trevor Booker 9 16.2 123 75
Nene Hilario 10 32.5 102 49
Drew Gooden 10 14.6 106 37
Martell Webster 11 17.7 77 35
Andre Miller 11 9.8 86 12
Al Harrington 7 8.4 24 -22
Garrett Temple 10 .9 24 -33
Otto Porter 3 2.0 15 -49
Kevin Seraphin 4 1.5 35 -274

RS PPA = regular season

PS PPA = post-season

The numbers reflect Ariza’s tremendous playoffs performance. A 193 in the regular season would be worthy of All-NBA selection in most years. Among playoff performers with at least 100 total minutes, it ranked third overall behind Lebron James (263) and Chris Paul (211).

Gortat’s production improved as the playoffs went on. His first round PPA was a shade below average, but his play against Indy in round two pulled his full playoffs rating into the vicinity of his regular season performance.

The team’s only other above-average playoffs producer was Beal, who was terrific in round one (152) and solid in round two. A promising post-season debut for a talented kid who will still be among the league’s youngest players when he starts his third season in a few weeks.

The post-season wasn’t so kind to Beal’s backcourt partner, John Wall. In the first round, Wall’s overall production wasn’t overwhelming, but he thoroughly outplayed Chicago’s guards. Indiana did a better job of forcing him out of comfortable plays, and Wall struggled.

Now-departed Trevor Booker was solid in the first round, but played little in the second round. Friend of the blog Ben Becker wondered if Washington might have won against the Pacers if they’d played Booker instead of Gooden and/or Harrington. And, that’s definitely possible. The games were close and hard-fought, and the Wizards got next to nothing from Gooden and less than nothing from Harrington. Booker was fifth on the team in per minute production during the post-season, but 10th in round two minutes.

Against the Pacers, the Wizards got good production from Gortat, and little else from the front-court. Using the trio of Nenê, Gooden and Harrington with so little court time for Booker may well have cost Washington a trip to the Eastern Conference Finals.

Similarity scores coming soon.

Path Opening for Wizards to Make Deep Playoff Run

Ariza dominating

As enjoyable as the Wizards-Bulls series has been so far (for Wizards fans, at least), there’s a tangible feeling that Washington has drawn to an inside straight. (That’s a fancy poker way of saying they’ve gotten lucky.) Yes, I’m aware the Wizards have looked good in the playoffs — teams look good when they win.

I’m also aware that the “experts” at ESPN and TNT (and elsewhere) have declared this Washington as a near-perfect squad with “no weaknesses.” But, much (most?) of the commentary has been a veritable catalog of cognitive biases. Over the course of six months and 82 games, the Wizards were average. A perfectly average team playing against their schedule would be expected to win 43-44 games. They won 44. That’s not a team without weakness — it’s an average team.

In the playoffs, they’re beating the Bulls — a slightly better than average team overall this season, but also a team with a major flaw: one of the league’s worst offenses.

Meanwhile, the Indiana Pacers have continued their post-All-Star break swoon and are struggling to keep pace with the sub.500 Atlanta Hawks. The Wizards should be favored against either team in a second round matchup. Which would put Washington into the conference finals against (probably) the Miami Heat.

It’s the 2013-14 NBA Eastern Conference, where being meh is good enough because nearly everyone else is meh-er.

In many ways, the Wizards this season are a fascinating experiment in perception. On one hand, there’s a solidly average regular season and no top-end production. On the other hand, there’s a likely first-round win against the Bulls and a good chance they make a run to the Eastern Conference Finals.

Folks in the “they’re really not that good” camp can point to the historically weak conference and Indiana’s meltdown, which carved out the path. But…it’s not Washington’s fault their opponents suck. The only thing they can do is play their game and beat whoever’s put in front of them. Being average when others are bad might be a functional equivalent of being good.

For me, it’s clear that the Wizards are an average team that’s drawn a flawed opponent in the first round and has a very good chance of getting a flawed opponent in the second round as well. That said, being average this season and next is probably good enough to hang around in the playoffs for the next year or two before Washington’s older players decline and other teams rebuild sufficiently. Washington won’t be a realistic title contender (even if they make the Eastern Conference Finals), but it’ll be fun to see them playing in May.

In other words, have fun, but don’t go overboard revising conclusions drawn from six months and 82 games worth of data over a few weeks against a couple opponents. What would be cause for some revision? Beating the Heat and making it to the Finals.

At any rate, here are a couple looks at the Wizards-Bulls first round series through the first four games. First up, here’s Player Production Average. PPA is an overall evaluation stat I developed. It’s designed to credit players for things they do that help a team win and “debit” them for things that don’t — each in proper proportion. It’s a pace-adjusted, per minute stat that accounts for defense and includes a degree of difficulty factor based on the level of competition a player faces while on the floor. In PPA, 100 = average, higher is better and 45 = replacement level.)

Player TEAM G MPG PPA
Taj Gibson CHI 4 32.3 215
Trevor Ariza WAS 4 39.5 212
Mike Dunleavy CHI 4 32.3 168
Bradley Beal WAS 4 40.8 161
Martell Webster WAS 4 18.5 135
John Wall WAS 4 38.5 121
Trevor Booker WAS 4 24.5 99
Marcin Gortat WAS 4 36.8 86
Joakim Noah CHI 4 41.8 85
Carlos Boozer CHI 4 23.3 76
Nene Hilario WAS 3 34.7 74
Jimmy Butler CHI 4 43.8 70
Andre Miller WAS 4 10.8 63
D.J. Augustin CHI 4 29.5 43
Kirk Hinrich CHI 4 32.0 0
Kevin Seraphin WAS 1 1.0 0
Drew Gooden WAS 4 9.0 -33
Tony Snell CHI 4 10.3 -59
Nazr Mohammed CHI 2 2.5 -180
Al Harrington WAS 3 2.3 -346
Garrett Temple WAS 3 0.3 -1408

The top two producers have been Taj Gibson and Trevor Ariza. Mike Dunleavy’s high rating is largely a product of a single terrific game in a small sample size. Bradley Beal is having a good series. John Wall and Martell Webster have also been solid.

Folks have gotten excited about Nenê’s play, but the big man hasn’t really played all that well outside of game one.

Want to see why Chicago is struggling? Their only above average performers in these four games have been Gibson and Dunleavy. Noah, Boozer and Butler have been subpar. Augustin and Hinrich have been wretched — especially Hinrich who has given the Bulls 32.0 minutes per game of nothing.

Last, here’s a look at estimated wins added (call them eWins) for the series:

Player TEAM G MPG eWINS
Trevor Ariza WAS 4 39.5 0.68
Taj Gibson CHI 4 32.3 0.56
Bradley Beal WAS 4 40.8 0.53
Mike Dunleavy CHI 4 32.3 0.44
John Wall WAS 4 38.5 0.38
Joakim Noah CHI 4 41.8 0.29
Marcin Gortat WAS 4 36.8 0.26
Jimmy Butler CHI 4 43.8 0.25
Martell Webster WAS 4 18.5 0.20
Trevor Booker WAS 4 24.5 0.20
Nene Hilario WAS 3 34.7 0.16
Carlos Boozer CHI 4 23.3 0.14
D.J. Augustin CHI 4 29.5 0.10
Andre Miller WAS 4 10.8 0.05
Kirk Hinrich CHI 4 32.0 0.00
Kevin Seraphin WAS 1 1.0 0.00
Nazr Mohammed CHI 2 2.5 -0.02
Drew Gooden WAS 4 9.0 -0.02
Garrett Temple WAS 3 0.3 -0.03
Tony Snell CHI 4 10.3 -0.05
Al Harrington WAS 3 2.3 -0.05

This eWins approach uses total production to estimate each player’s individual share of team wins. It works reasonably well over the full season. For the series, it has the Wizards with a 2.4 to 1.7 eWins lead, which is reflective of a couple very close games (Washington’s overtime win in game two, and Chicago’s narrow game three victory.)

Wizards Slouching Toward the Playoffs

The numbers in the table below are this week’s Player Production Average (PPA) update. PPA is a metric I developed that credits players for things that contribute to winning and debits them for things that don’t — each in proper proportion. PPA is pace adjusted, accounts for defense and includes a degree of difficulty factor. In PPA, 100 = average, higher is better and 45 = replacement level. PPA is a per minute stat.

PLAYER GMS MPG LW PPA
Marcin Gortat 77 32.9 150 153
Trevor Ariza 73 35.7 151 143
John Wall 78 36.6 141 138
Trevor Booker 68 21.4 115 119
Drew Gooden 20 18.6 127 114
Nene Hilario 50 29.9 101 100
Andre Miller 24 14.4 104 91
Bradley Beal 69 34.7 89 89
Martell Webster 74 28.1 82 80
Jan Vesely 33 14.2 68 68
Kevin Seraphin 50 11.4 35 37
Chris Singleton 24 10.4 34 32
Garrett Temple 71 8.9 25 25
Glen Rice 11 9.9 20 20
Otto Porter 33 8.2 13 19
Al Harrington 30 14.9 13 8
Eric Maynor 23 9.3 8 8

Rough week for the Wizards, which is reflected in the individual numbers. On the positive side were Marcin Gorat, (who continues to have a good season), Trevor Booker (who many fans want removed from the rotation), and Otto Porter (who performed better, but still rates well below replacement level).

Even with a bad week, Trevor Ariza is having a career season. He gets a bit of a pass for the last few games — he’s been beset with the flu, and really shouldn’t have even been on the floor.

John Wall’s production fell for a third straight week. It’s been fashionable to celebrate Wall’s improvement and his ascendancy to All-Star status, but it’s worth noting that his 138 PPA this season is virtually identical to the 139 he posted last year.

Here’s a visualization of each player’s PPA through the season. Since this is basically a weekly rolling season average, the larger fluctuations at the beginning followed by a flatter line toward the end is to be expected. Note the fairly steady climb of Gortat’s PPA — he’s been playing better as the season has progressed. The production slip from Wall the past three weeks is also apparent.

Check out the steady production from Booker. Webster’s season-long decline is apparent in his graph.

Drew Gooden’s production has fallen steeply after a hot start. He may not be the godsend Wizards fans had hoped for. Andre Miller’s play has been up and down, but at least sorta trending up.

ppa trend

Wizards Weekly: Playoffs Clinched

wall past carmelo

Since the Wizards cemented a spot in this year’s playoffs, I’m going to focus more on the stellar play of Trevor Ariza and Marcin Gortat, and sorta gloss over the things that bug me a bit in this week’s numbers.

Some positives:

  • Al Harrington had a good enough week that he no longer rates as the league’s least productive power forward. That honor belongs to Brandon Davies.
  • Marcin Gortat’s PPA rose to 150 — the highest its been since December 11.
  • I missed it last week, but the Wizards have no one with a negative PPA. The team’s least productive player is Eric Maynor, but he’s not in the NBA after being released by Philadelphia.
  • Otto Porter scored nine points in five minutes, and added 10 points to his PPA.

Below is this week’s Player Production Average (PPA) update. PPA is a metric I developed that credits players for things that contribute to winning and debits them for things that don’t — each in proper proportion. PPA is pace adjusted, accounts for defense and includes a degree of difficulty factor. In PPA, 100 = average, higher is better and 45 = replacement level. PPA is a per minute stat.

PLAYER GMS MPG LW PPA
Trevor Ariza 70 35.7 151 151
Marcin Gortat 74 32.7 145 150
John Wall 75 36.6 144 141
Drew Gooden 17 18.9 148 127
Trevor Booker 65 21.0 116 115
Andre Miller 21 14.8 81 104
Nene Hilario 49 30.1 101 101
Bradley Beal 66 34.5 90 89
Martell Webster 71 28.2 81 82
Jan Vesely 33 14.2 68 68
Kevin Seraphin 49 11.5 36 35
Chris Singleton 23 10.7 40 34
Garrett Temple 69 9.1 22 25
Glen Rice 11 9.9 20 20
Al Harrington 28 15.5 1 13
Otto Porter 32 8.2 3 13
Eric Maynor 23 9.3 8 8

Okay, I can’t help myself — now for the stuff that worries me:

  • Wall’s PPA is down to 141. That’s a good score, but his PPA last season was 139. And his offensive efficiency has slipped back below average.
  • Gooden’s PPA dropped sharply this week. His efficiency numbers are still insanely good — heck, all his numbers are, except for defense. There are way too many defensive breakdowns when he’s on the floor, and he continues to lose points in the defense portion of PPA.
  • Beal and Webster both rate solidly below average. This isn’t a surprise — Beal’s still a kid trying to figure out his spot in the league, and Webster is basically regressing to his mean this season. But, it does mean the Wizards aren’t getting a ton of production from their SG — and both rate as below average defenders.


The Briefest of Wizards Updates

In keeping with established Wizards traditions, Al Harrington is currently the NBA's least productive PF.
In keeping with established Wizards traditions, Al Harrington is currently the NBA’s least productive PF.

Don’t have a ton of time for fancy prose — not with friend of the blog Ben Becker inviting himself to be a guest blogger next week and filling my inbox with questions.

So…here’s this week’s Player Production Average (PPA) update. PPA is a metric I developed that credits players for things that contribute to winning and debits them for things that don’t — each in proper proportion. PPA is pace adjusted, accounts for defense and includes a degree of difficulty factor. In PPA, 100 = average, higher is better and 45 = replacement level. PPA is a per minute stat.

PLAYER GMS MPG LW PPA
Trevor Ariza 66 36.0 154 151
Drew Gooden 13 17.5 152 148
Marcin Gortat 70 32.9 147 145
John Wall 71 36.8 146 144
Trevor Booker 61 21.1 116 116
Nene Hilario 49 30.1 103 101
Bradley Beal 62 34.4 88 90
Andre Miller 17 14.3 75 81
Martell Webster 67 28.4 84 81
Jan Vesely 33 14.2 69 68
Chris Singleton 22 11.0 40 40
Kevin Seraphin 47 11.8 40 36
Garrett Temple 66 9.4 23 22
Glen Rice 11 9.9 21 20
Eric Maynor 23 9.3 8 8
Otto Porter 31 8.3 3 3
Al Harrington 24 15.0 -2 1

Unsurprisingly given the team’s record during their recent series against the Western Conference, the production of their top players was down a little across the board. Nothing major — just…the kind of thing to be expected when they face some tougher competition than they get in the East.

I don’t know how much Martell Webster’s back is bothering him, but his production is way down this season. Last season, he posted a career-best PPA of 114. This season, he’s back down at his career level. This is cause for concern.

Also, I’ve heard/seen folks in a variety of places refer to the Wizards as a “young team.” But….not so. They’re right at the league average in age, but their rotation at this point is older. I’ll probably look at this in greater detail next week, but consider this:

  • The team’s plan was “build through the draft,” but only three of their rotation players (Wall, Beal and Booker) were selected by the Wizards.
  • Those same three players are the team’s only rotation players younger than league average.
  • Once Nenê returns they’ll have more rotation guys age 30 or older (four) than they do under age 26 (three).

The team does have young players on the roster, but they’ve been decidedly unproductive this season — for much of their careers for most of them.

In keeping with Wizards tradition, Al Harrington currently rates as the NBA’s least productive PF (minimum 300 minutes). Last season, that title was held by Jan Vesely.

Wizards Update: The NCAA Tournament Edition

gooden celebrates

With the sporting world mostly focused on The High Holy Weekend of NCAA basketball, last night I took in the Wizards game. I enjoy college hoop…to a point…but, truth is that I’d rather watch a regular season NBA game than an NCAA tourney game.

Yes, I’m serious.

The tournament is fun with its single elimination format, but the level of play just isn’t there. Think about it like this: let’s say you want to hear a musical performance tonight. And let’s say you have a choice between say Beyonce (or fill the name of your favorite singer/band) or the best kid at your local college. Which one would you choose (assuming both are free)?

That said, I still love the NCAA tournament because of all the randomness. I estimated Duke as a roughly 75% favorite against Mercer, yet the Blue Devils are going home and Coach K was on the bench with that “holy crap I’m gonna get clobbered in the press for this” look on his face.

But, I’m way off topic.

The Wizards are en route to their first playoff berth in a few years, and their best season since they had guys like Antawn Jamison, Caron Butler and Brendan Haywood. All season, I’ve been bothered by the significant quality difference between the NBA’s conferences. Washington is a solid playoff team in the East, but would be on the outside looking in if they were in the West.

Here’s a quick look at that difference:

OPPONENT WINS LOSSES W% W82
vs. EAST 562 457 .553 45.3
vs. WEST 455 564 .448 36.7

Pretty straightforward. When teams play against an Eastern Conference opponent, they win 55% of the time. When they play against a Western Conference opponent, they win about 45% of the time. That W82 is wins per 82 games. A perfectly average team playing against Eastern Conference opponents could expect to win 45 games over an 82-game season. That same team would win roughly 37 against Western Conference opponents.

Only four teams this season have a better winning percentage against Western Conference opponents than they do against the East — the Clippers, Miami, Brooklyn and Cleveland.

The Wizards have the league’s fifth highest East vs. West differential. Against the East, their winning percentage is .610. Against the West, it’s .370. The teams with bigger differentials: Boston, New Orleans, Detroit and Portland. Against opponents in the East, Washington plays like a 50-win team. Against the West: 30. That’s significant. In other words, Washington is fortunate to be in the East this year.

By the way, I’m not saying the Wizards need to apologize for their schedule. All they can do is play who’s on the calendar for that day, and they don’t have control over opponent incompetence or organizational tanking decisions. Even if the league seeded the playoffs without regard to conference affiliation, Washington would make the post-season (as the 15 seed, but still).

Here’s this week’s Player Production Average (PPA) update. PPA is a metric I developed that credits players for things that contribute to winning and debits them for things that don’t — each in proper proportion. PPA is pace adjusted, accounts for defense and includes a degree of difficulty factor. In PPA, 100 = average, higher is better and 45 = replacement level. PPA is a per minute stat.

PLAYER GMS MPG LW PPA
Trevor Ariza 63 36.0 159 154
Drew Gooden 10 17.1 149 152
Marcin Gortat 67 32.9 149 147
John Wall 68 36.8 144 146
Trevor Booker 58 21.2 114 116
Nene Hilario 49 30.1 103 103
Bradley Beal 59 34.3 94 88
Martell Webster 64 28.6 90 84
Andre Miller 14 13.9 96 75
Jan Vesely 33 14.2 69 69
Chris Singleton 22 11.0 45 40
Kevin Seraphin 45 12.2 42 40
Garrett Temple 63 9.9 21 23
Glen Rice 11 9.9 21 21
Eric Maynor 23 9.3 8 8
Otto Porter 30 8.6 3 3
Al Harrington 21 14.7 -6 -2

Drew Gooden has been an excellent scrap heap pickup for the Wizards. He’s played just 171 minutes so far, but those minutes have been at a borderline All-Star level. Very bad things have been happening defensively when he’s in the game, which bears watching. Bad defense has been a rap on him throughout his career.

The Wizards saw production dips this week from Bradley Beal, Martell Webster and Andre Miller. Al Harrington continues to get minutes, and continues to play very badly. I’d hope that the Harrington experiment ends when Nenê returns.

If the big man comes back healthy and ready to play, head coach Randy Wittman will have a nine-man rotation of Wall and Miller at PG, Beal and Webster at SG, Ariza and Webster at SF, Nenê, Gooden and Booker at PF, and Gortat, Nenê and Gooden at C. That still probably won’t be enough to win a first round series, but it should be good enough to at least make things competitive and fun to watch.

Upon Further Review: Grunfeld Still Not Good At His Job

grunfeld

I’m willing to admit when I’m wrong. Especially when there’s evidence to offer correction. Last week, Mike Wise sought to convince readers not just that Washington Wizards president would receive a contract extension after the season, but that he deserves one.

I didn’t find Wise’s argument convincing, but your mileage may vary. Today, Scott Cacciola, writing for the New York Times (where Wise wrote for 10 years), has a piece that echoes much of what Wise wrote. My first thoughts were along the same lines as my response to Wise. But, this is two articles in two weeks, and the Wizards are better this season, and Ted Leonsis seems pretty happy with Grunfeld, and Leonsis is a smart guy who’s made a few bucketfuls of money…

So, maybe I’m just being hard-headed. Maybe Grunfeld has been doing a just spiffy job and I’ve…missed it. Perhaps I’ve permitted bias to creep into my thinking and I’ve been unfair in my analysis of the Wizards and of Grunfeld’s work. So, using Cacciola’s article as a launch point, I’m going to take as objective a look as I can at the claims he makes in support of Grunfeld.

First up:

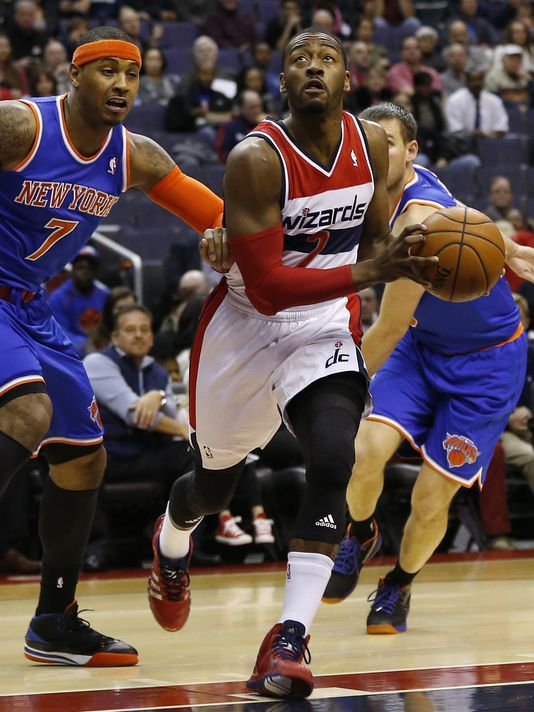
After so much futility, after so much losing and after so much false hope, the Wizards have finally reinvented themselves as a relevant team — thriving, even, with an energetic nucleus that features Beal and John Wall, 23, a first-time All-Star whose ability to run the court is virtually unmatched in the N.B.A.

The Wizards were 33-31 after Wednesday’s loss to the Charlotte Bobcats, in solid position for a playoff berth.

The first difficulty in analyzing this passage is the use of glittery words that don’t have real meaning. “Relevant team” means what? There’s little doubt the Wizards will make the playoffs this season, but does anyone think they have a shot against either the Heat or the Pacers? Does anyone believe the Wizards would currently be sitting sixth in the West? They’re reasonably fun to watch, and it’ll be great to see them back in the postseason. But, relevant? Depends on what folks want it to mean, I guess.

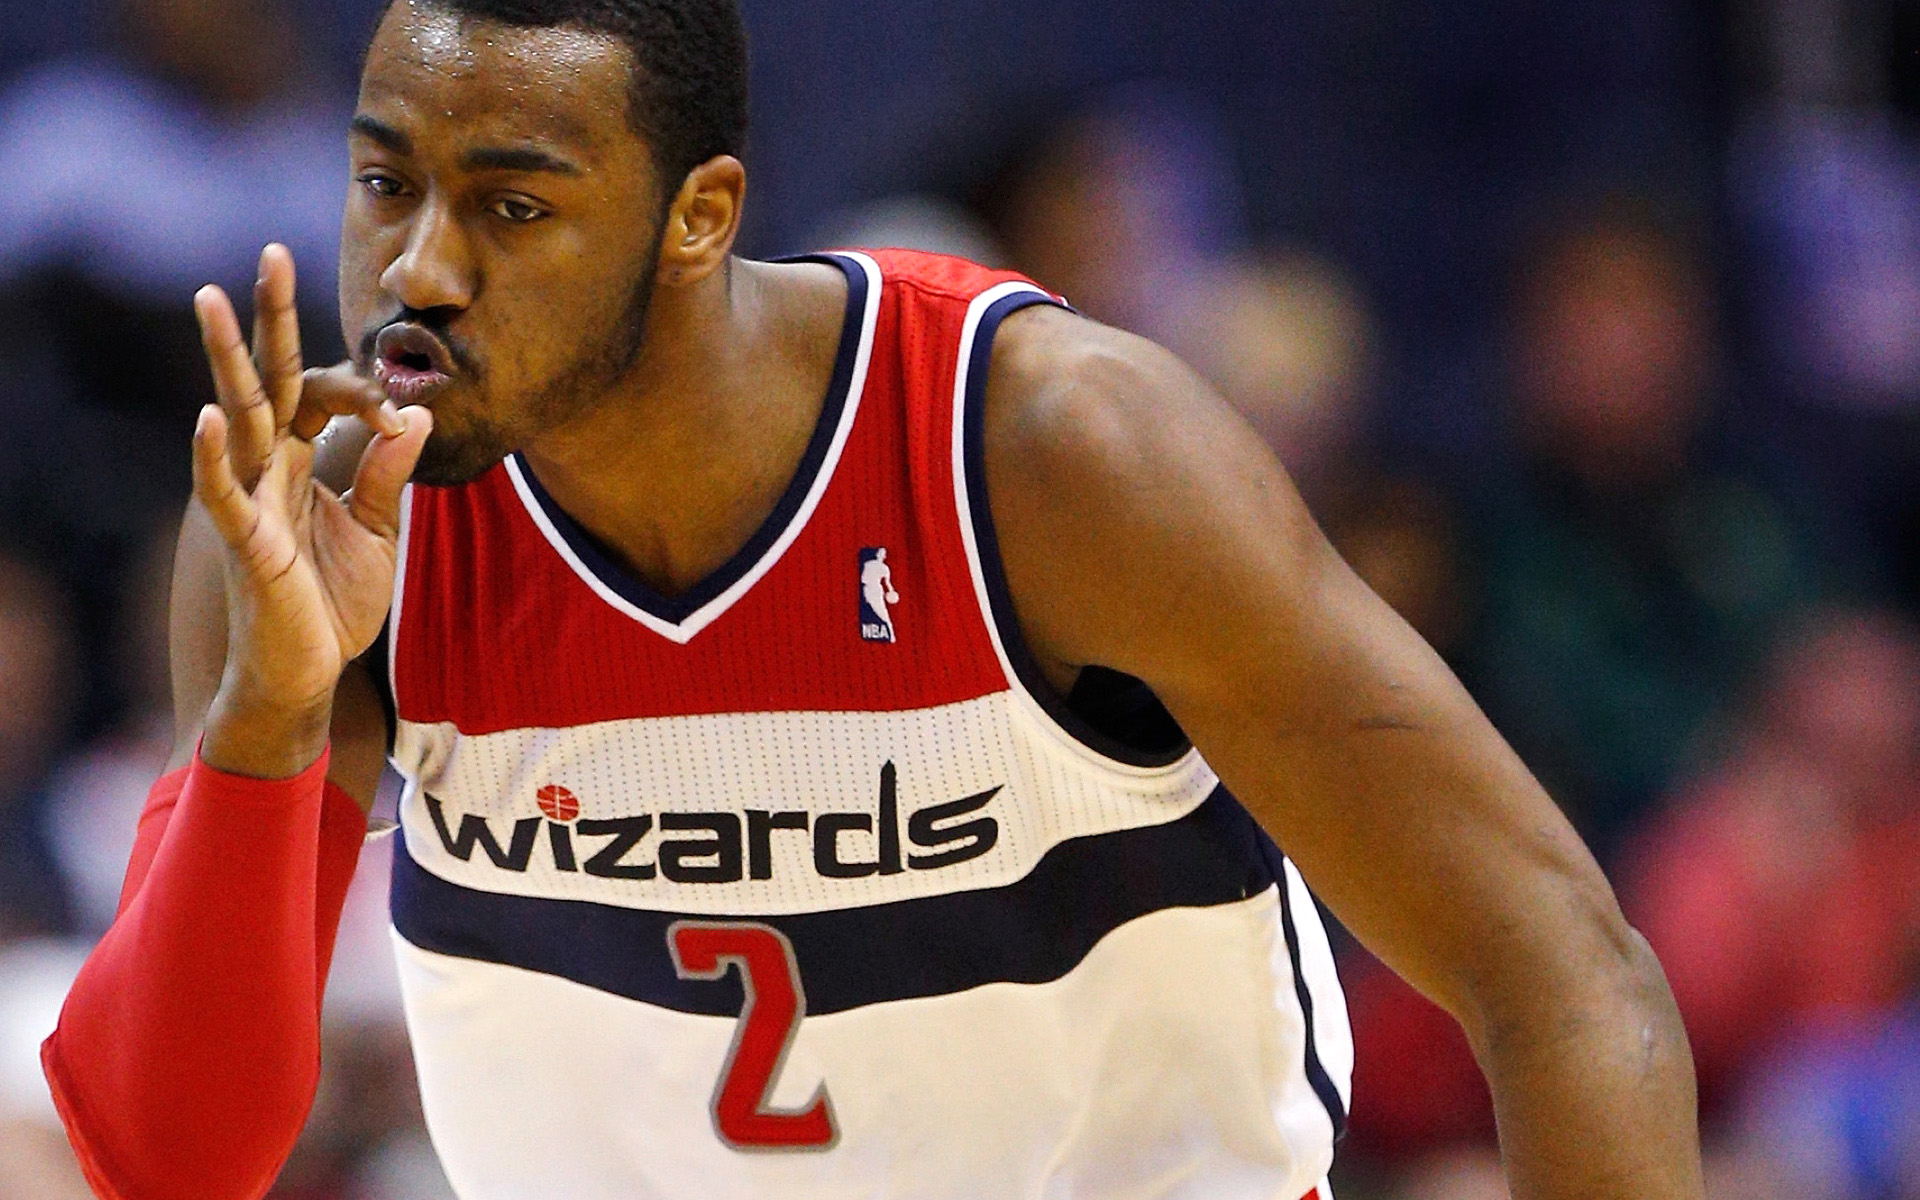
Cacciola identifies the “energetic nucleus” as being Bradley Beal and John Wall, which is something Wise did as well. To me, “nucleus” would suggest players who are currently the primary causes for the team winning. Wall fits that description, even if his production still falls well short of league elite status.

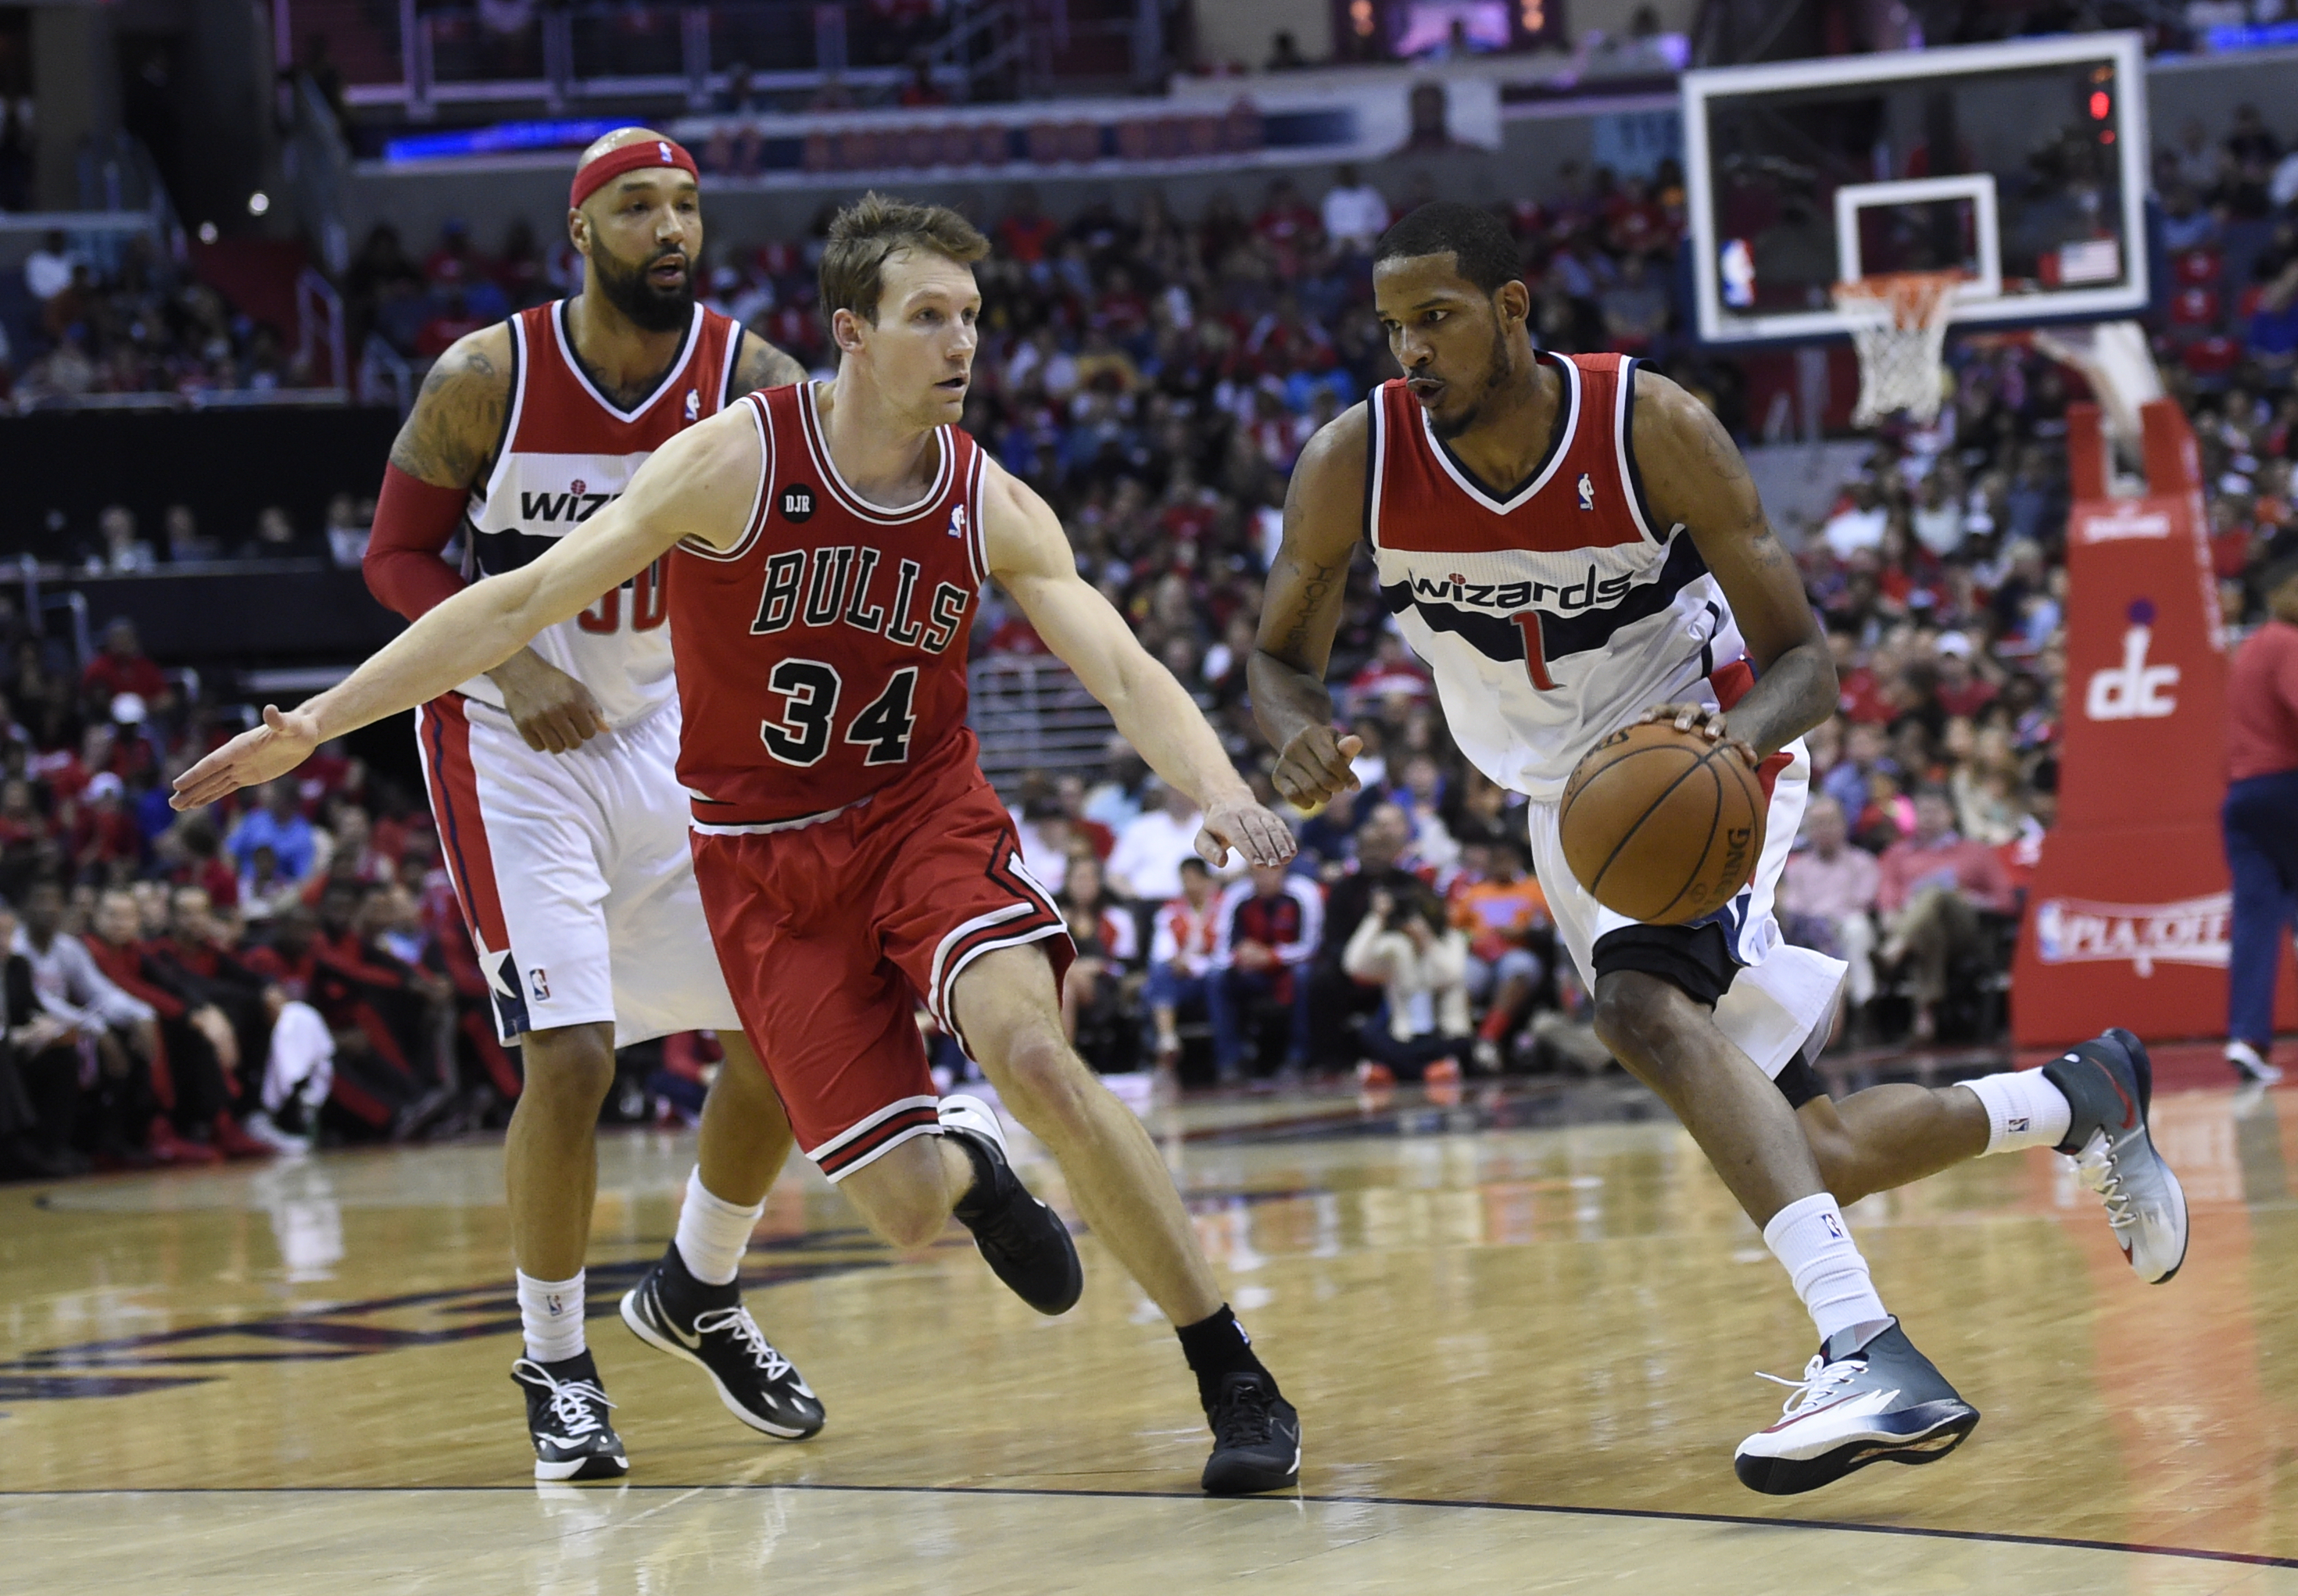
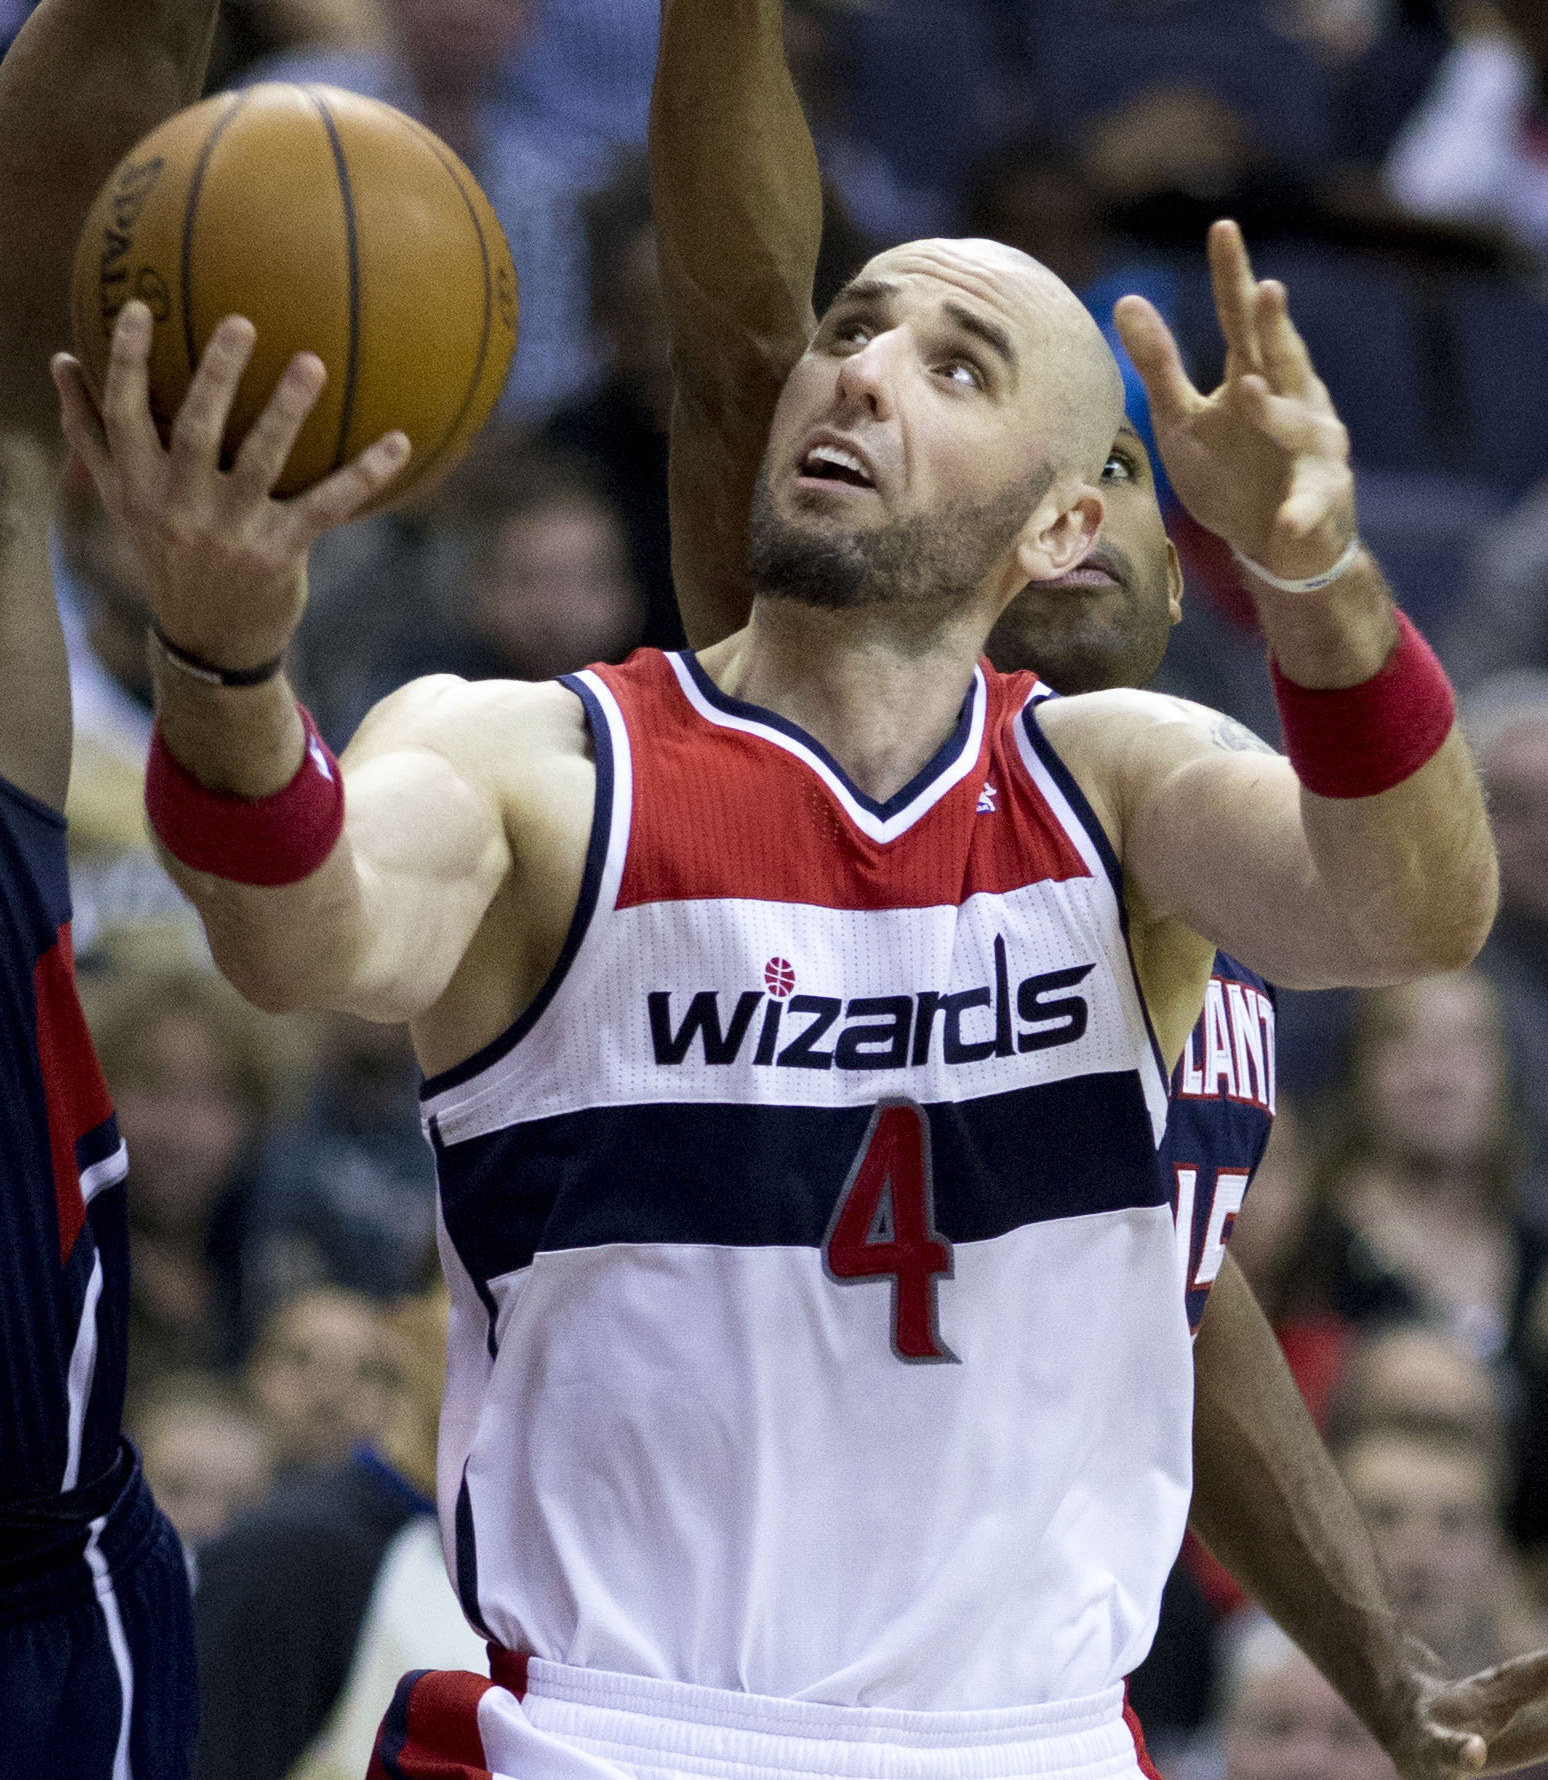
But Beal? Maybe next year he’ll reach “nucleus” status. Perhaps the year after. This season, he’s fourth in total production (using the Player Production Average metric I developed), but the clear “nucleus” of the team this season is comprised of Wall, Trevor Ariza and Marcin Gortat.

Perhaps Cacciola means that Beal and Wall will be the nucleus in the future, but that’s not what he wrote. The word “thriving” indicates something ongoing — something happening in the here and now.

Cacciola writes:

Patience is not a word frequently used in professional sports. Fans are impatient. Owners are impatient. Yet the quest to win now, and win by any means necessary, often turns out to be an ill-conceived approach, one that strips the team of long-term stability.

This is kind of a logic trap because it asserts a problem and a conclusion without offering supporting evidence. People are impatient. Impatience is bad because it strips the team of long-term stability. Cacciola offers up the Knicks as an example, but there are some problems. First, an anecdote isn’t evidence. Second, even if he’d cited two or three examples, the plural of “anecdote” isn’t “evidence.” And third, he hasn’t shown that the Knicks’ problem is impatience. I’d argue it’s been incompetence.

Cacciola seems to share Leonsis’s belief in The Continuity Theorem.  The logic of the Theorem is this: hire a team (management, coaches, players), keep them together, give them time, and…voila…winner. The foundation of the Continuity Theorem is that continuity causes success. I think it’s wrong, though. Or, at least that it’s stated the wrong way around. That is to say: continuity doesn’t cause success, but rather success causes continuity.

Let’s try a thought experiment. Imagine assembling a team of say Eric Maynor, Nick Young, Chris Singleton, Jan Vesely, Kevin Seraphin, Garrett Temple, Jordan Crawford, Cartier Martin, Trevor Booker, and Jason Collins. Let’s say that squad is coached by Randy Wittman. How long should we keep this group together to produce a winner? How long until it makes the playoffs? Wins a series? Reaches the Finals?

The reason good teams have continuity is that they’re good. When a team has good players, it doesn’t want to make major personnel changes except for age, injury and expense. When a team has bad players, there must be turnover because the way to improve is to replace bad players with good ones. Now, if you have young players you believe in — AND they work hard — those players can transform themselves into good players. That’s the hope with Beal, Wall and Otto Porter. But, they don’t get better because they’ve been kept together, they get better because they work hard and smart and they mature.

So, back to the Wizards and Grunfeld and this notion of the team being patient so as not to strip itself of “long-term stability.” Grunfeld has been in his position since the 2003-04 season. During that span, the Wizards have the league’s third worst winning percentage. They’re 13 games behind Sacramento for fourth worst. Washington’s best team (so far) in the Grunfeld era: 45-37 — tied for 123rd “best.”

It’s been 17 seasons since the Spurs had a season that bad.

I think it’s fair to say that Wizards fans have been patient.

More from Cacciola:

Grunfeld, 58, declined to discuss his tenure with the Knicks, preferring instead to talk about the Wizards, whom he joined in 2003. The Wizards made four straight playoff appearances starting in 2004-5, but then came the lean seasons — 19 wins in 2008-9, for example — as the team coped with injuries, off-the-court problems and an ownership change. Still, Grunfeld survived when many others would have been fired.

All fair points. The Wizards have had injuries (especially the ones that effectively ended the career of Gilbert Arenas), off-court “issues” and a change in ownership. The off-court issues were at least in part of management’s making. They picked guys known to lack maturity (Nick Young, Javale McGee, Andray Blatche, Jordan Crawford, Javaris Crittenton, Arenas), and then contributed to a lax atmosphere that a former assistant coach described as “Romper Room.”

As for the ownership “change,” I’m not convinced it’s a major factor in Grunfeld’s execution of his responsibilities. Former owner Abe Pollin gave Grunfeld a “win now” instruction. He didn’t instruct Grunfeld to trade the fifth pick in the draft for Mike Miller and Randy Foye, and then let both walk as free agents. Pollin didn’t tell Grunfeld which players to draft or which free agents to pursue. He told Grunfeld to win. It was up to Grunfeld to figure out how to do it. What happened? Over a season and a half, they went 36-96 before saying “uncle” and trading away high-priced veterans.

But hey, stability is good, right?

Writes Cacciola:

Ted Leonsis, who became the majority owner in June 2010, told Grunfeld to rebuild the team through the draft, a goal that Leonsis knew would take time to achieve. Time is not an especially valued commodity in professional sports, but Leonsis was committed to using some.

“From Day 1, he said, ‘This is what we’re going to do, and it’s going to be painful at first,’ ” Grunfeld recalled. “ ‘But we’ll see the results as we move forward.’ And I think we’re starting to see it now. It’s still a process. We still have things we want to accomplish. But we feel like we have a very solid core.”

The process, as Grunfeld described it, started with Wall, a high-energy point guard who was the top overall pick in the 2010 draft. While Wall would be the team’s centerpiece, Grunfeld said he knew he needed to surround him with perimeter scorers who could space the floor.

With that in mind, Grunfeld went through free agency to sign Martell Webster, a dependable 3-point shooter. Grunfeld also acquired center Nene in a three-way trade that sent Nick Young to the Los Angeles Clippers and JaVale McGee to the Denver Nuggets. Four months later, the Wizards drafted Beal.

This is a curious mix of building on the unsupported Continuity Theorem, and selective omission of relevant information. Notice that there’s a key date missing — an entire year, in fact. That year: 2011, also known as a time when Washington was building through the draft and Grunfeld chose Jan Vesely, Chris Singleton and Shelvin Mack.

As many have written countless times, after careful evaluation, analysis and thought, Grunfeld picked Vesely ahead of Kawhi Leonard and Kenneth Faried, chose Singleton over Faried; and then plucked Mack before Chandler Parsons and Isaiah Thomas. That’s not retroactive 20/20 hindsight stuff — there was an array of fans using publicly available information who said the Wizards were making mistakes at the time.

What’s happened? Last season, Vesely was the league’s least productive PF. This season he’s better than that, but still not much above replacement level. And he’s in Denver, dealt there as part of the deal to bring in a 37-year old backup PG. Last season, Singleton was one of the NBA’s five least productive PFs. This year, he’s right at replacement level. Mack wasn’t anything outstanding, but a) was the most productive player the Wizards selected in 2011; and b) was showing some signs that he could become an acceptable (and cheap) backup PG. So, of course the Wizards cut him twice to keep less productive players.

A previous draft analysis I did using PER suggested that Grunfeld was roughly average as a drafter. I’m planning a more extensive analysis later this year using PPA (which does a better job than PER of determining who wins and who loses in the NBA) — if I can find the time between responding to “All Hail Grunfeld!” articles.

More from Cacciola:

Today, the only players who remain from the team’s 23-win season in 2010-11 are Wall, Trevor Booker and Kevin Seraphin, who are all young and productive and understand their roles.

This one is a puzzler. Wall and Booker can both be described as “young and productive,” but “productive” doesn’t work with Seraphin. Last season, Seraphin was the league’s least productive center. This year, he’s not quite as bad, but he’s still below replacement level. His strength is supposed to be scoring, but he’s had exactly one season with even average efficiency. He’s sort of a poor man’s Eddy Curry — the ball goes in the basket at a decent rate when he manages to shoot, but he’s a terrible passer and a turnover machine. He can be doubled with impunity because he’s more than twice as likely to turn it over than to assist a teammate. And he rebounds like a small forward.

Cacciola finishes up with this:

Grunfeld said he would continue to take a measured approach. He cited the slow upward arc of the Oklahoma City Thunder, who struggled to make much noise in Kevin Durant’s first few seasons in the league.

Durant developed, and the Thunder picked up important pieces to supplement his skills. There was never any panic, only patience.

“It doesn’t happen overnight,” Grunfeld said.

If I was in Grunfeld’s position, I don’t think I’d invite comparisons to what Oklahoma City has done, but…

Wall was the obvious pick at number one in 2010 just as Durant was the obvious pick at two (since Portland had already selected Greg Oden). Neither pick is indicative of basketball acumen — nearly anyone would have made the same choices.

But, I’m puzzled by this assertion about the Thunder’s “…slow upward arc.” Here’s a quick comparison of the first four seasons of Durant and Wall (and their teams):

SEASON DURANT PPA OKC WINS WALL PPA WAS WINS
1 88 20 93 23
2 146 23 110 23*
3 201 50 139 29
4 172 55 144 42**
Avg. 154 37 119 29

* — That was the year of the NBA’s labor dispute, which shortened the season. The Wizards won 20 games that season, but I’ve extrapolated to an 82-game season.

** — So far this season the Wizards have 33 wins. Their current winning percentage multiplied by 82 games comes to 42. Their scoring differential is that of a 42-43 win team.

What I see in the table is that Wall was a tad better than Durant as a rookie, but that Durant improved much faster. Perhaps not coincidentally, Oklahoma City’s wins went up faster well. The first two seasons were similarly terrible for both teams, but then the Thunder jumped to 50 wins in Durant’s third season while the Wizards managed just 29 in Wall’s.

Of course, Wall was injured for a significant chunk of his third season, but with him they were a game under .500. I won’t argue if folks prefer to claim 40-42 wins for that third season. The basic point still stands — namely, that OKC’s arc wasn’t “slow.” It was horizontal for two seasons and then turned sharply up. From Durant’s second season to his third, they more than doubled their win total. The Wizards’ arc has been slow, however.

Since the Wizards were attempting to emulate the Thunder’s approach (building through the draft), it’s worth comparing what the teams did with their picks. In the three drafts following Durant’s, OKC added Russell Westbrook and Serge Ibaka in 2008, and James Harden in 2009. Their 2010 draft was a bust — they traded multiple first rounders and got essentially nothing in return.

In the years following the selection of Wall, Seraphin and Booker, Grunfeld picked Vesely and Singleton in 2011, Beal in 2012, and Porter in 2013. Washington’s 2011 draft class will never be what the 2008 draft was for OKC. Beal’s first two seasons are a flatter version of Harden’s. The Wizards youngster had a rookie PPA of 92 and he’s currently at 94 in year two. Harden’s rookie season of 73 grew into a 101 (league average is 100) in his second year and jumped to 142 in his third. It’s way premature to make a call on Porter. The early returns don’t look favorable.

That’s seven first round picks for the Wizards since 2010. Wall is good. Booker is solid. Beal will probably be well above average. Let’s give Porter an incomplete. What I see is a clear reason why the team has shifted from building through the draft to making trades for established veterans: the failed 2011 draft. It seems odd to tout the team’s young “core” while ignoring that they’ve been forced to trade for starters and construct a geriatric bench because they’ve drafted so badly.

And, Cacciola omitted another piece of relevant information when assessing Grunfeld’s performance: the egregious free agent signing of Eric Maynor, who was given the full biannual exception and a player option on a second season despite four seasons of sub-par play in the NBA. Maynor, of course, was so bad in Washington that he had to be traded (along with Vesely AND a future second round pick) for the 37-year old Andre Miller.

So, after careful reivew, I remain unpersuaded that Grunfeld has done a good job running the Washington Wizards. Maybe next week someone from the New York Post can try to convince me.