Wizards Update: Two Steps Forward, One Step Back

rasual

Over the past week, the Wizards rolled to convincing wins over the hapless Lakers and the not-awful Nuggets, and then lost a shoulda-won game against a middling Celtics squad. And, in the grand tradition of players having good games shortly after I rip them, Kevin Seraphin had probably his best game of the year against Denver.

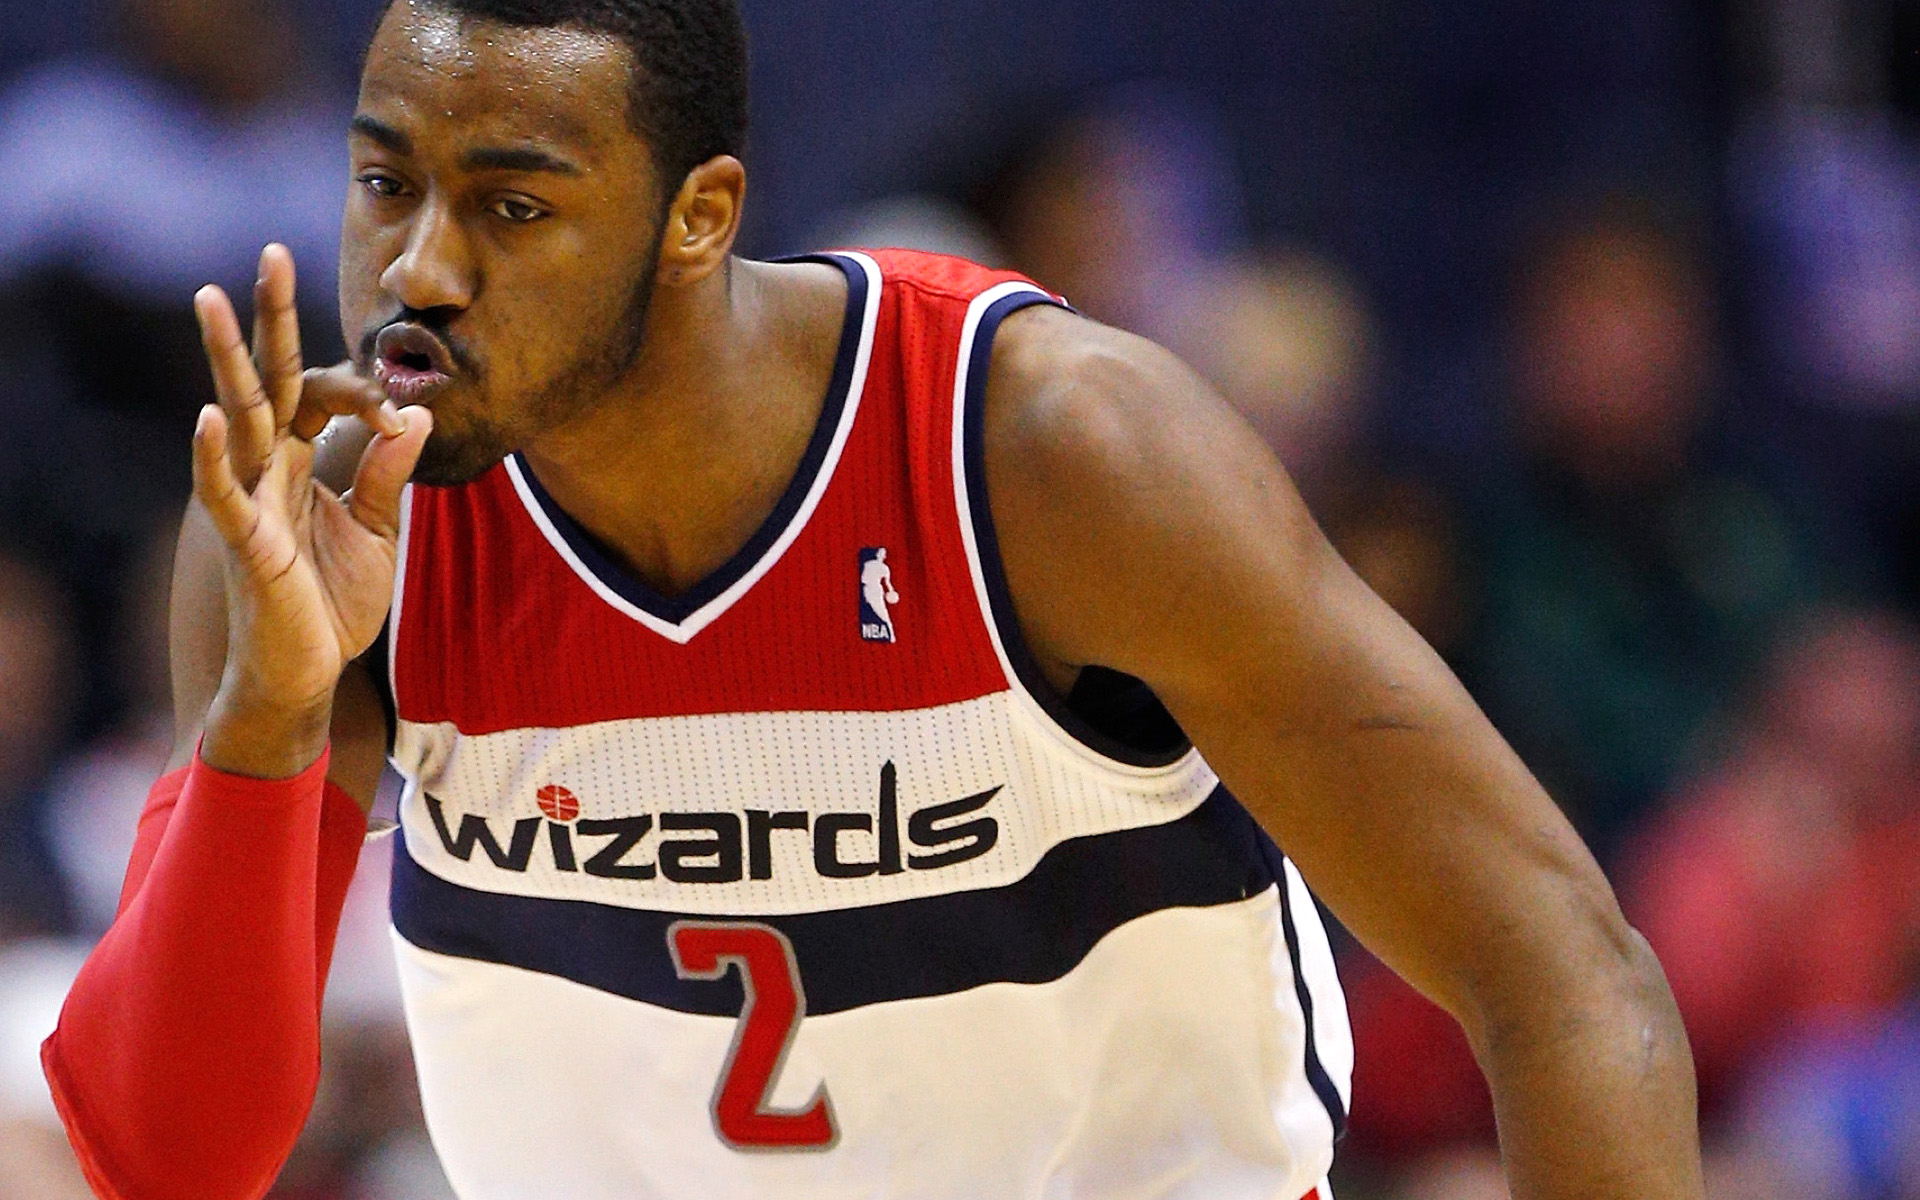
Meanwhile, John Wall climbed into a tie with Rajon Rondo for having the biggest defensive impact for a point guard in my rating system. Wall shows up in my numbers as having the biggest defensive impact on the Wizards so far this season. Not bad for a guy who I still think has room for improvement on the defensive end.

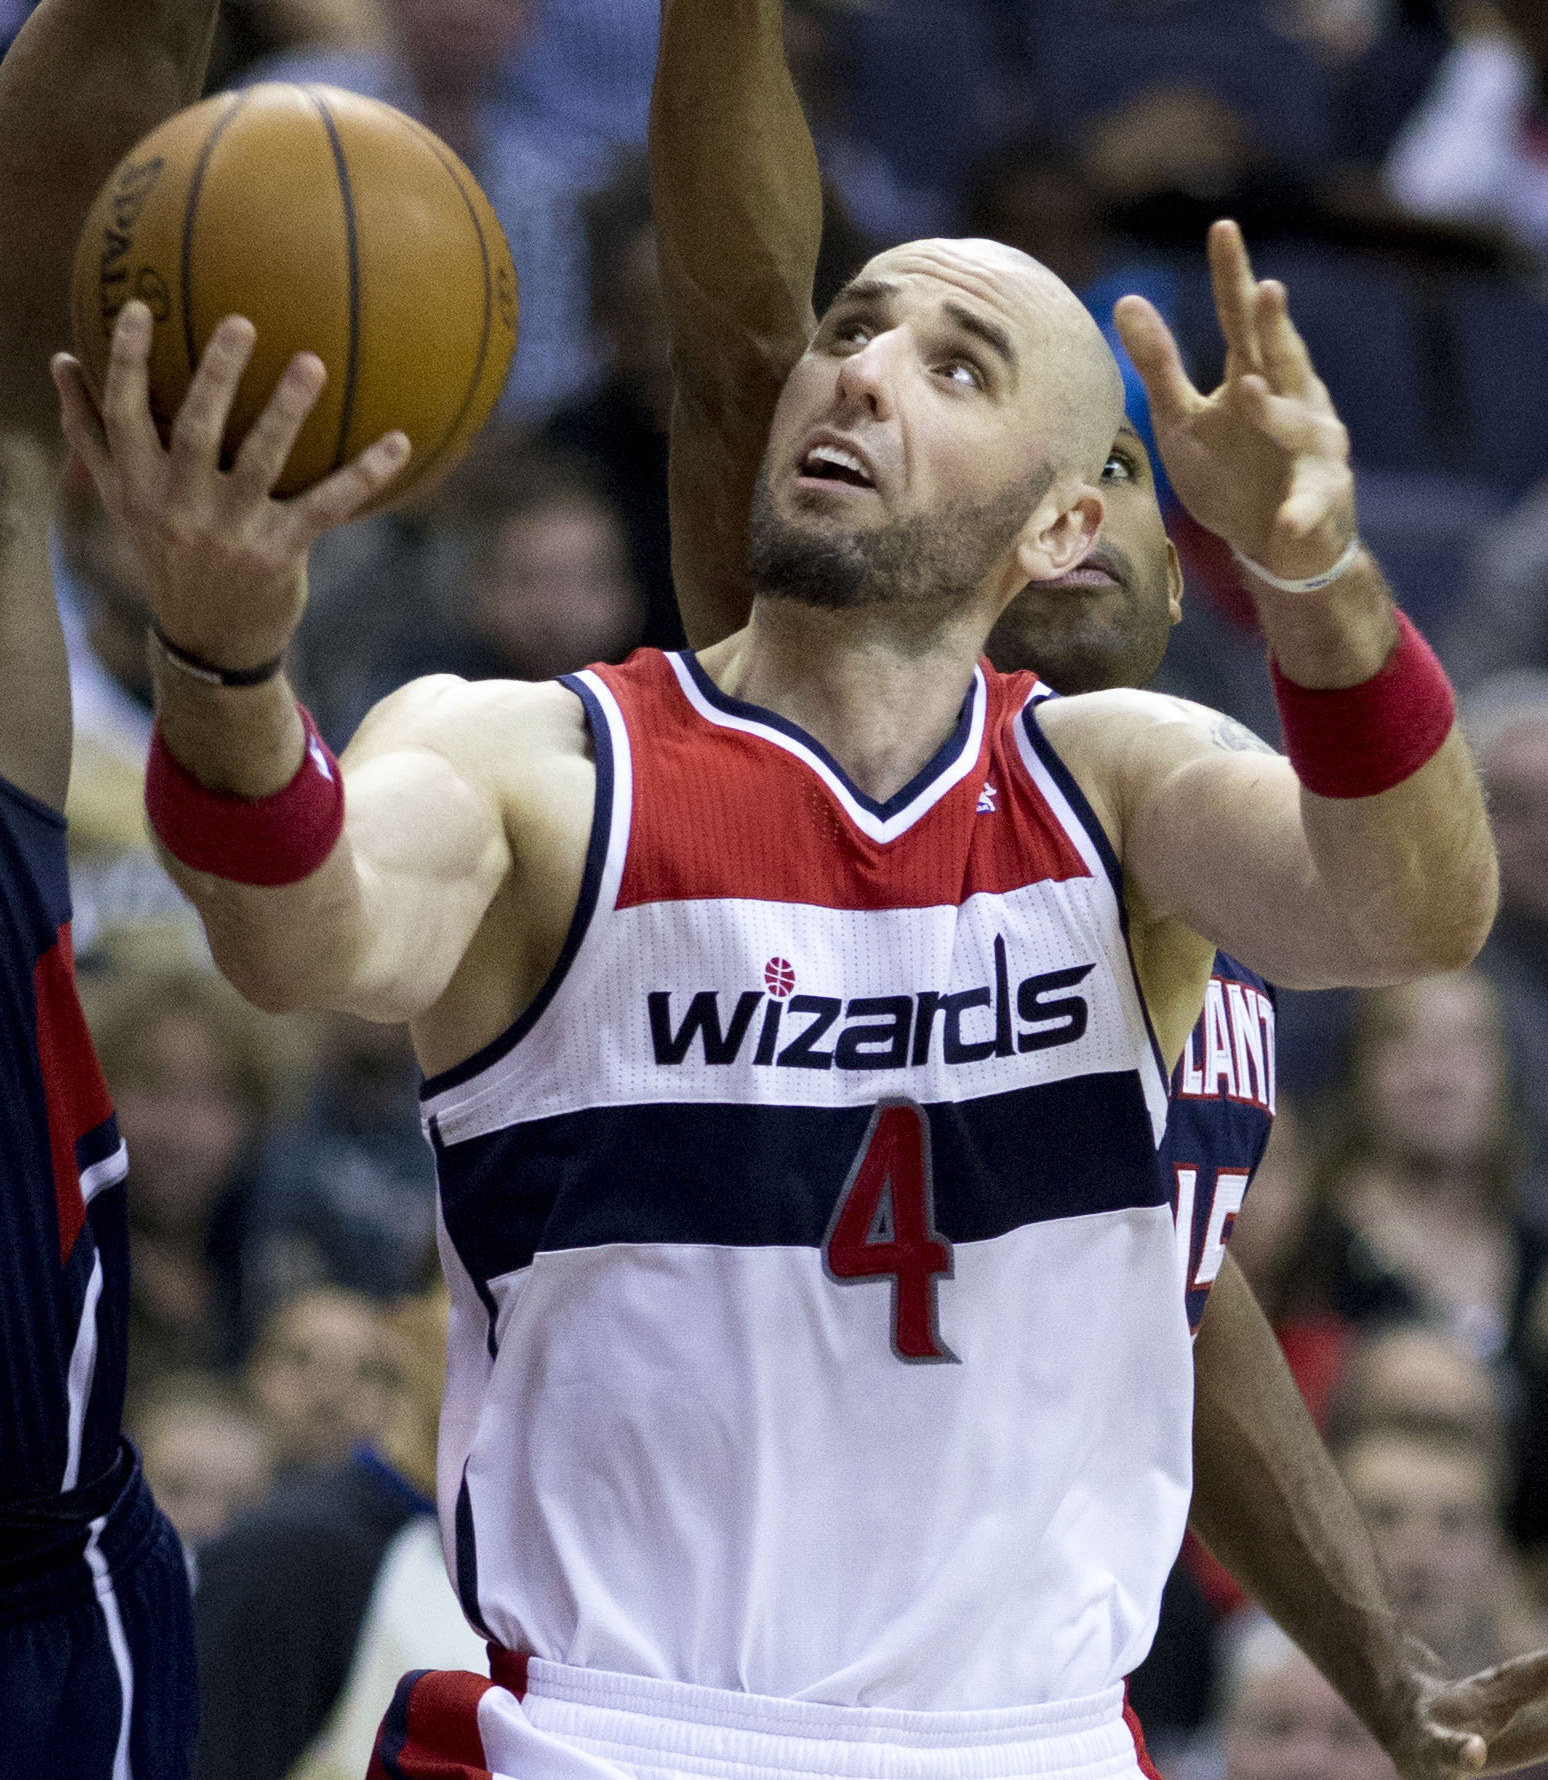
Other positive defenders: Marcin Gortat, Nenê, Kris Humphries, and Garrett Temple.

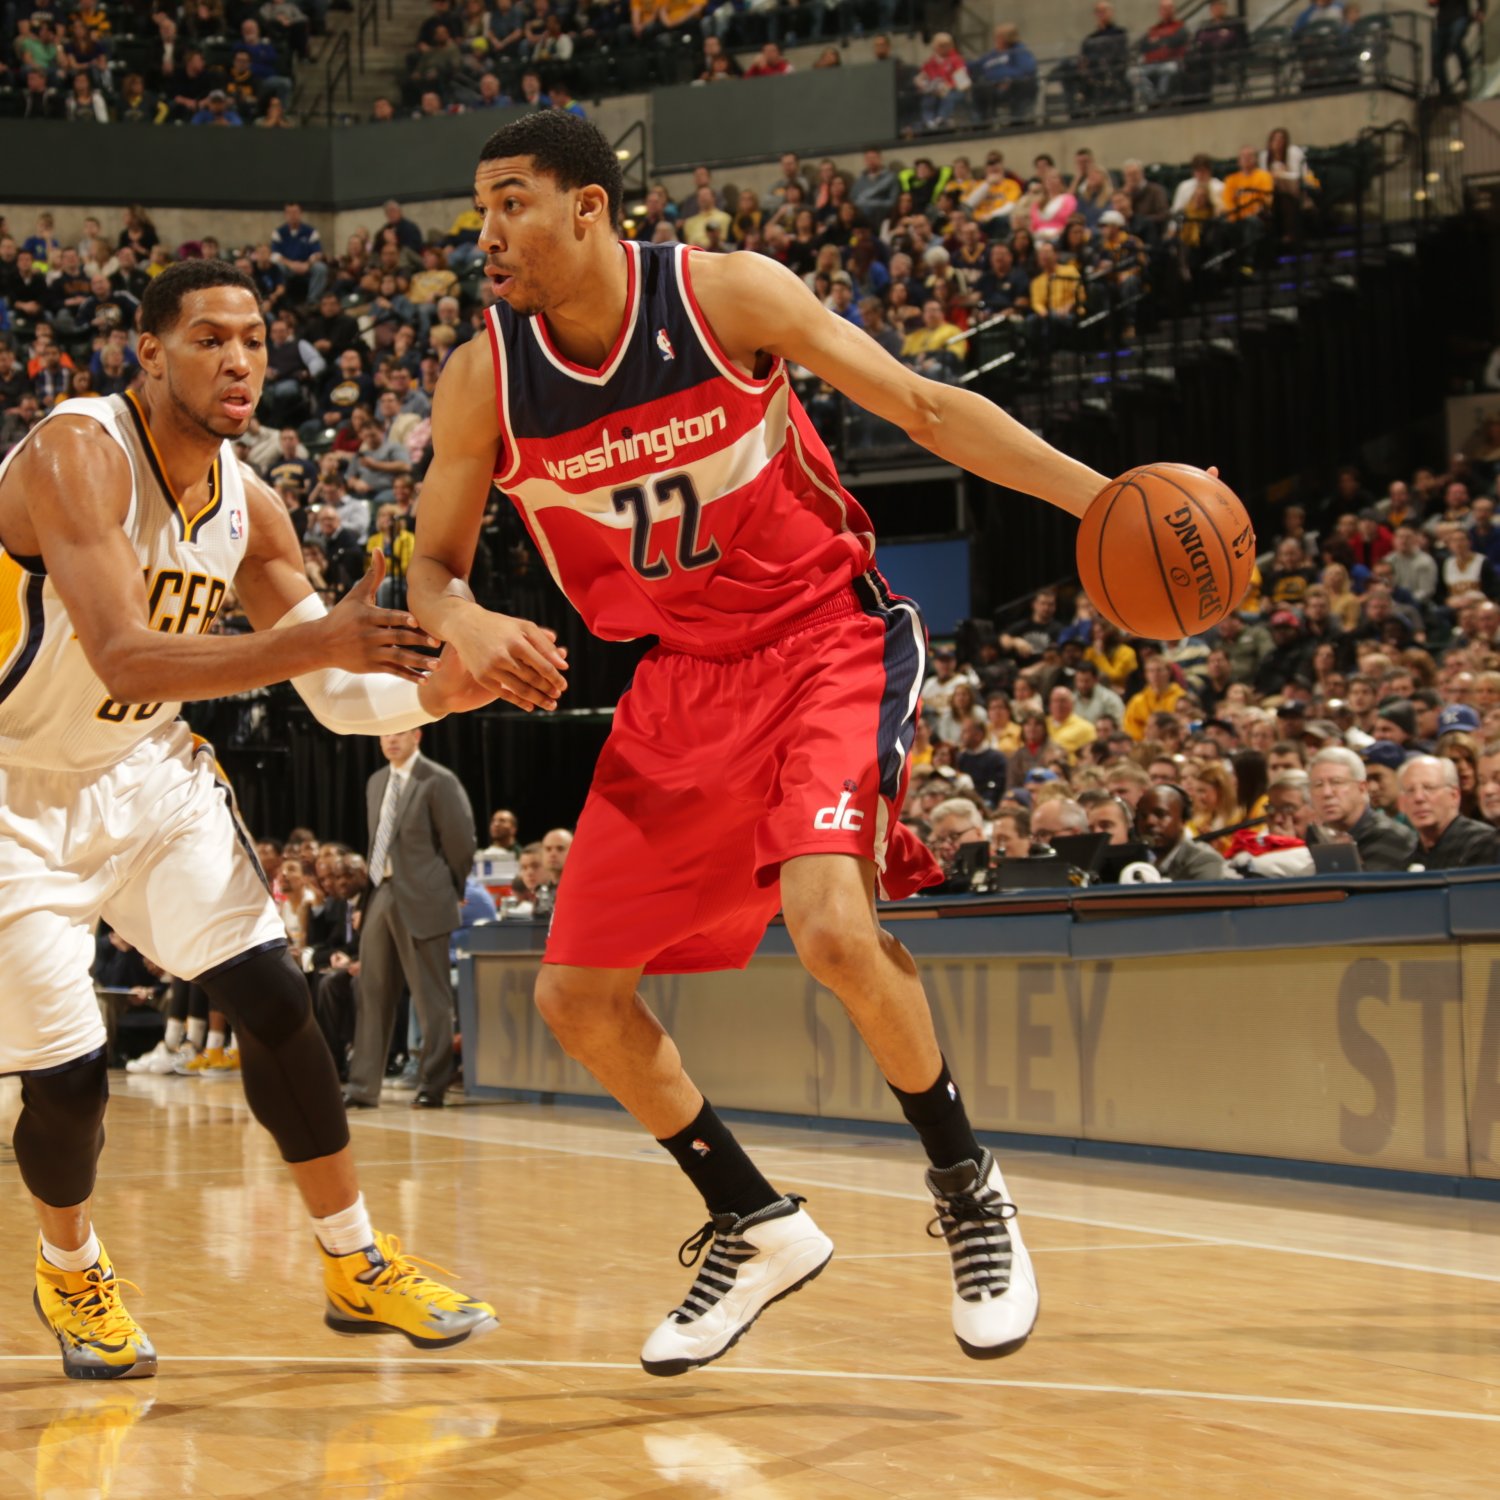
The “about average” grouping includes: Otto Porter, Rasual Butler and Paul Pierce. Pierce, had gotten off to an excellent start defensively, but his individual performance seems to have slipped a bit over the past couple weeks.

Bradley Beal and Drew Gooden are in the “bad defensive impact” category so far. Kevin Seraphin and Andre Miller are defensive dumpster fires to this point in the year.

Below is the Player Production Average (PPA) update. PPA is an overall rating stat I developed that credits players for things they do that help a team win and debits them for things that hurt the cause. PPA is per-minute, pace neutral, accounts for defense, and includes a “degree of difficulty” factor based on the level of competition a player faces while on the floor. In PPA, 100 = average, higher is better and replacement level is 45.

PLAYER GMS MPG 10-Nov 18-Nov 24-Nov 3-Dec PPA
Marcin Gortat 19 30.5 181 186 170 175 179
John Wall 19 35.3 185 180 180 168 167
Rasual Butler 15 20.3 60 131 116 128 155
Paul Pierce 19 26.6 140 138 165 134 134
Kris Humphries 18 19.7 46 87 90 82 109
Andre Miller 19 12.6 72 69 92 103 102
Garrett Temple 17 20.2 121 112 96 100 98
Otto Porter 18 21.9 97 106 101 95 84
Nene Hilario 13 25.5 108 102 68 67 83
Bradley Beal 10 30.4 122 63 69
Drew Gooden 12 17.3 42 40 59 78 64
Kevin Seraphin 18 15.2 38 13 17 12 28
DeJuan Blair 6 5.7 -41 -40 -40 -74 -56
Glen Rice 5 8.6 -120 -117 -117 -117 -114

The first thing I wondered about when perusing the table above was the lack of change in Wall’s PPA. My feeling was that he had a terrific week. But, the game log shows that he shoot poorly (efg of just .395) and that he committed 14 turnovers.

Rasual Butler had another week of outlandishly good shooting. In non-shooting categories, Butler’s numbers are all within established career norms. So far in Washington, he’s shooting .579 from 2pt range (vs. a career average of .435), and .545 from 3pt range (vs. a career average of .364).

I know fans want to attribute this to The Wall Effect, but a) only about half Butler’s minutes have been with Wall; b) he’s shooting with outlandish accuracy (and more often) when Wall’s on the bench; and c) his shooting numbers in Indiana last season were also significantly better than his previous career norms.

Butler efg usg
with Wall .765 13.8%
w/o Wall .700 20.3%

It may simply be that Butler worked hard and improved his shooting late in his career. And, it may be that he’s ripe for a regression. Sample sizes are still small: just 304 minutes and 112 shot attempts so far this season.

I’d like to see the Wizards continue to start Humprhies and bring Nenê off the bench. The starting lineup doesn’t appear to have suffered with the change, which isn’t surprising considering how little Nenê was producing. I suspect Nenê’s production will improve going against bench bigs. And, bringing him off the bench, gives the coaching staff options at PF and C, which means they can drop Seraphin from the rotation.

Despite the loss to Boston, the week was a positive one for the Wizards. Good teams win games convincingly. They don’t necessarily have the best record in close games, because they often avoid close games in the first place. That Washington won three in a row (including the win against Miami) by double digits may be a marker of the team getting stronger.

Wizards Update: Rolling in the East

It’s good to be a Wizards fan right now. The team is 9-3, and reasonable forecasts suggest they’re probably the second best team in their conference. That the conference is historically weak isn’t their fault. The front office put together a solid, veteran squad, and the rest of the conference backed up.

So far this season, the NBA’s collective record vs. Eastern Conference teams is 111-85. That’s a .566 winning percentage, which works out to about 46 wins over an 82-game schedule.

Against the Western Conference, the NBA’s collective record is 86-112, which is a .434 winning percentage. That means about 36 wins over an 82-game schedule.

In other words, we would expect an average team facing the East to win about 46 games…which is what Basketball-Reference forecasts for the Wizards. To highlight the relative power differential between conferences, Basketball Reference predicts the Wizards will finish the season as the second best team in the East, but with an SRS (a robust and “simple” rating system that combines a team’s scoring differential with that of its opponents) that would land it 11th in the West.

But, this is a “moment in time” snapshot. The picture changes a bit with every game played. And there are still a ton of games on the schedule.

Before I get to this week’s stat update, I wanted to address a recurring sentiment I’ve been hearing from an array of Wizards fans. Basically, it’s some variation on the theme that Kevin Seraphin is having a good season or a breakout game or a coming out party or developing into a valuable reserve.

He’s not. At least not so far.

In fact, he’s playing poorly, even compared to his previous performances, which ranked him as the league’s least productive center (per minute) two seasons ago, and the second least productive center last season.

On offense, he’s shooting a good percentage this season, but continues to be a poor passer and a turnover machine. He rates as having very little defensive impact,because of his anemic defensive rebounding and rampant fouling.

The measuring stick on Seraphin is so off that one fan (who later suggested it was the beer talking) tweeted a rave about Seraphin being a revelation on a night the big fella shot 2-7 from the floor.

Here’s Seraphin’s game-by-game PPA scores for this season:

GMS MIN PPA
1 7.7 -202
2 1.9 -1003
3 22.1 184
4 13.9 -84
5 18.1 64
6 19.5 139
7 16.7 -70
8 16.1 -36
9 10.6 -36
10 23.4 83
11 13.1 -29

In PPA, 100 = average and higher is better. In 11 games, Seraphin has managed an above-average production rate twice. He’s been a net negative seven times — six, if you prefer to throw out the two-minute stint in the second game of the season.

I like Seraphin, the person. But, he’s not a good NBA player. He hasn’t become one. He’s showing very few signs of developing into one. The Wizards need to find another option as their backup center.

Below is the Player Production Average (PPA) update. PPA is an overall rating stat I developed that credits players for things they do that help a team win and debits them for things that hurt the cause. PPA is per-minute, pace neutral, accounts for defense, and includes a “degree of difficulty” factor based on the level of competition a player faces while on the floor. In PPA, 100 = average, higher is better and replacement level is 45.

PLAYER GMS MPG 10-Nov 18-Nov PPA
John Wall 12 35.7 185 180 180
Marcin Gortat 12 30.9 181 186 170
Paul Pierce 12 27.5 140 138 165
Bradley Beal 3 30.7 122
Rasual Butler 8 16.4 60 131 116
Otto Porter 11 24.4 97 106 101
Garrett Temple 12 26.8 121 112 96
Andre Miller 12 12.6 72 69 92
Kris Humphries 11 15.6 46 87 90
Nene Hilario 11 27.1 108 102 68
Drew Gooden 7 18.0 42 40 59
Kevin Seraphin 11 14.8 38 13 17
DeJuan Blair 3 3.7 -41 -40 -40
Glen Rice 5 8.6 -120 -117 -117

This week, I’ve added a column to show each of the previous PPA updates. I’ll keep doing that as long as there’s space.

Wall seems to be settling in at a very high performance level. It’s scary to think there’s still lots of room for improvement too. Seth Partnow at BBall Breakdown did a nice job of summarizing the problem with Wall’s shot selection. Improved decision-making would likely improve the PG’s individual efficiency, and give his team a much-needed boost.

I don’t see how the Wizards could have hoped for more from Pierce, who is performing at a high level in the early going this season.

Nenê suffered a plantar fascia injury to his right foot in the win over Milwaukee. While it’s not good to lose a starter, Nenê has been playing nothing like a starter. His defense shows up as a slight net positive, but doesn’t come close to offsetting his awful offensive efficiency.

Wizards Update: Still Cause for Concern

wittman & gortat

The Wizards are 7-2 to start the season, which ought to be cause for celebration. And, judging by media reports and fan reaction, that’s mostly what’s happening. So what’s wrong with me?

I’m unconvinced that the good record is particularly meaningful. This is not to suggest the Wizards need to apologize for the competition they’ve faced. They don’t make the schedule, and it’s not their fault that the East is possibly weaker than it was last season — when it was aggressively bad. All Washington can do is keep beating whoever’s on the calendar, which is what they’ve been doing so far.

But…I’m still concerned because of the way they’ve been winning. In sports, the best teams typically have the highest scoring differentials. The Wizards this season stand 11th in scoring differential at +2.22, which doesn’t sound bad except that their opponents have a collective scoring differential of -2.52. In other words, the Wizards are winning by less than the rest of the league against their opponents. At least so far.

There’s a strong sentiment that’s something like: Hey, the Wizards are winning games they should win, which is real progress for this franchise. To an extent, I agree. But, what often happens to an average team (and the numbers are suggesting the Wizards are pretty average) is that over time, they’ll lose games they “shouldn’t.” And there are a TON of games left on the schedule.

Some have pointed out that Washington has played so far without Bradley Beal, which is true but perhaps not as meaningful as some think. Beal was pretty average last season, and didn’t project to make a huge leap this year (at least not in my preseason analysis). Much of what I anticipated he’d provide has been produced by Garrett Temple and Rasual Butler thus far.

Perhaps the best reason to think Washington might be able to win 48-50 games this season is the good fortune of playing in a historically weak conference. Just six Eastern Conference teams have a positive scoring differential so far, and the sixth (Brooklyn) is us by one point total so far this season. All that said, in Basketball-Reference’s simple rating system (which combines scoring margin with strength of schedule), the Wizards currently sit 16th overall and 6th in the East. If they want to make some noise this season, they need to play better.

Below is the Player Production Average (PPA) update. PPA is an overall rating stat I developed that credits players for things they do that help a team win and debits them for things that hurt the cause. PPA is pace neutral, accounts for defense, and includes a “degree of difficulty” factor based on the level of competition a player faces while on the floor. In PPA, 100 = average, higher is better and replacement level is 45.

PLAYER GMS MPG LW PPA
Marcin Gortat 9 31.3 181 186
John Wall 9 35.6 185 180
Paul Pierce 9 27.4 140 138
Rasual Butler 5 19.2 60 131
Garrett Temple 9 31.1 121 112
Otto Porter 9 24.2 97 106
Nene Hilario 8 28.6 108 102
Kris Humphries 8 13.9 46 87
Andre Miller 9 12.9 72 69
Drew Gooden 6 19.5 42 40
Kevin Seraphin 8 14.5 38 13
DeJuan Blair 3 3.7 -41 -40
Glen Rice 5 8.6 -120 -118

The numbers show Gortat and Wall playing outstanding basketball. Both are performing at an All-Star level. Wall could push his way into All-NBA consideration, if he continues. Gortat’s PPA is currently sixth among centers behind Tyson Chandler, Omer Asik, DeAndre Jordan, DeMarcus Cousins and Robin Lopez.

Biggest improvers this week were Butler and Humprhies. Largest drop was from Seraphin, whose field goal percentage dropped while his rebounding, turnovers and fouling remained poor.

Wizards Update: The Worries

wall the leap

The Washington Wizards are off to a 5-2 start, tied with Miami for first place in the NBA’s Southeast Division, and sitting on pretty good odds of getting to 7-2 before they face Dallas at Verizon Center. And yet…in classic Wizards’ follower fashion, I’m actually a little worried.

Yep, it’s good they’re winning. But, they should be winning given the quality of the opponents they’ve faced so far. No, this isn’t one of those “they would be X record if they’d faced teams A, B and C” critiques. I don’t believe a team (or its fans) should ever have to apologize for the schedule, which is something they don’t control.

What has me a little worried is how pedestrian the Wizards have looked so far this season. They’ve outscored their opponents by 1.57 points per game so far this season; the league has outscored their opponents by 1.99 points per game.

I’d be more willing to buy the injury excuse if they weren’t getting career-best play from Garrett Temple standing in for Bradley Beal and Martell Webster.

But, this is this “little worry” because we’re still in the annual performance of Small Sample Size Theater. A study by Kevin Pelton, then-writing for Basketball Prospectus, showed that team-level stats tend to stabilize around the 25th of the season. Other research has shown that per minute stats for individual players begin to have validity as quick as 150 minutes. More is better, though.

Still, the early indications are that, despite the good record early on, the Wizards are an average team again this season. They’ve been good defensively, but a bit below average on offense. The hope is that getting Beal and Webster will help bolster the team offensively when they can return from injury.

Here’s the first Player Production Average (PPA) update of 2014-15. PPA is an overall rating stat I developed that credits players for things they do that help a team win and debits them for things that hurt the cause. PPA is pace neutral, accounts for defense, and includes a “degree of difficulty” factor based on the level of competition a player faces while on the floor. In PPA, 100 = average, higher is better and replacement level is 45.

PLAYER GMS MPG PPA
John Wall 7 35.7 185
Marcin Gortat 7 32.7 181
Paul Pierce 7 28.0 140
Garrett Temple 7 33.7 121
Nene Hilario 6 29.2 108
Otto Porter 7 24.7 97
Andre Miller 7 12.9 72
Rasual Butler 3 14.3 60
Kris Humphries 6 9.8 46
Drew Gooden 6 19.5 42
Kevin Seraphin 6 13.8 38
DeJuan Blair 3 3.7 -41
Glen Rice 5 8.6 -120

Wall and Gortat should jump out immediately (they are at the top of the chart). Both guys have produced at an All-NBA level in the first seven games. This could be The Leap from Wall that fans have been waiting for. If he keeps it up. Gortat has actually performed at a 180ish PPA for a full season (2011-12).

Pierce has been everything Washington could have hoped he’d be. Over the summer, I went hunting through the stats to find players who’d be most likely to replace what Trevor Ariza had provided. The top name on the list: Paul Pierce. His offense could be more efficient, but he’s producing at about the level Ariza did last season — and his defense has been outstanding.

Nenê appears to have picked up more or less where he did last season, and that’s not such a great thing for the Wizards. He’s still a good defender, but his offensive efficiency seems to be departed.

It’s good to see Porter hovering around average. He’s been an asset off the bench, and seems to be figuring out the NBA game. Porter hasn’t been helped much by his oldster bench mates Miller and Gooden, who have been awful defensively since arriving in Washington.

And check out Porter look-alike Garrett Temple, who has so far played at the level of an almost-average NBA starter. Major kudos to Temple for all the work he’s done on his jumper. It shows in his form — especially in the way he sets his feet for takeoff, freezes the follow-through, and plants the landing.

I know folks are going to wonder about Kevin Seraphin, who rates below replacement level yet again. Seraphin is shooting 63% from the floor, and has had a couple nice games. His offensive efficiency is above average. And yet…he continues to be plagued by the same problems he’s had since his rookie year. Specifically, his rebounding is sub-par, he’s turnover prone, and he fouls too much.

Also worth noting are Kris Humprhies and DeJuan Blair, who were acquired in the offseason to provide frontcourt depth. So far, they’ve been behind Seraphin on the depth chart, which is astonishing. Humphries at least has some excuse — he missed three weeks of preseason with a hand injury. Blair has apparently been healthy, but can’t get on the floor despite dreadful play from Seraphin.

At some point, I gotta believe they’ll end the Seraphin experiment and give playing time to Humphries and/or Blair. Based on what they’ve done on the court so far this season, it’s fair to say that neither has made a case for playing ahead of Seraphin. At least not yet.

Projection: Wizards Will Win 45 and Return to the Playoffs

Improvement from the Washington Wizards youngsters, and an infusion of frontcourt depth will be offset by missed time due to injuries and declines from the team’s older players to keep the team in the middle of the NBA pack for another year. However, the team could be a dangerous playoffs matchup if they’re able to enter the postseason healthy.

Below, I’m offering up projections done a couple different ways. The first is built on the similarity scores I’ve posted after the past week. This approach finds players in NBA history with similar production at a similar age, and then looks at what they did in subsequent seasons. Those findings are then applied to the Wizards roster and combined with a playing time estimate for each player.

For this estimate (and the other one, which I’ll get to later in this post), I’ve used my overall metric Player Production Average (PPA), which is calibrated to explain individual player contributions to winning and losing. PPA is pace neutral, accounts for defense, and includes a “degree of difficulty” factor based on the level of competition a player faces while on the court. In PPA, 100 = average, higher is better, and 45 = replacement level.

Statistical Doppelganger Projection

POS PLAYER MIN LAST SEASON PPA PROJECTED PPA PROJECTED kWins
PG John Wall 2812 139 156 9.0
C Marcin Gortat 2464 154 132 6.7
SG Bradley Beal 2325 96 112 6.1
SF Paul Pierce 1800 139 108 4.0
SF Otto Porter 1800 15 85 3.2
PF Kris Humprhies 1608 132 133 4.4
F/C DeJuan Blair 1450 97 97 2.9
PF Nenê 1430 102 90 2.7
PG Andre Miller 1165 86 65 1.6
G/F Glen Rice Jr. 1029 20 78 1.2
F/C Drew Gooden 1002 106 100 2.1
G/F Martell Webster 1000 77 74 1.5
POS TEAM 19885 107 110 45.4

MIN = projected TOTAL minutes for the upcoming season

Projected kWins = how many wins that player will contribute based on his projected PPA and projected total minutes.

Over the past few seasons, the Wizards’ front office has converted the team from being one of the league’s youngest to being one of the league’s oldest. Gortat, Nenê, Pierce, Gooden and Miller all figure to play prominent roles this season, and all are past 30. Well past 30 for Pierce and Miller.

Projections for Porter and Rice were difficult because they played so little last season. For both, I elected to throw out their rookie numbers and rely instead on projections based on the rookie seasons of the players they were most like from college. Using the rookie numbers would lower Porter’s projected PPA to 66 and Rice’s to 30. That would drop Washington’s projected win total 43.8.

Note that I didn’t include Kevin Seraphin, Garrett Temple or Rasual Butler in the above table. They’ll get some minutes along the way, but — barring several catastrophic injuries — none should see enough court time to have a major effect on the team’s fortunes. For those interested, this is what I project for the end-of-the-bench trio:

  • Garrett Temple: 33
  • Kevin Seraphin: 49
  • Rasual Butler: 55

I can hear the cockeyed optimists already: “Why do you just assume the old guys will get worse? What if they maintain for a year?” Quick answer (and one I’ve given before): athletes past 30 tend to two things — get hurt and get worse.

But, let’s say the “Ancients” are able to do this season what they did last year. In that event, Washington’s projected win total would climb to 48.5. Which would be hella fun.

On the other hand, there are scenarios where there are more injuries than expected, younger players don’t make anticipated improvements and/or older players decline more steeply. That gives a potential “bottom” of 40.7 wins.

Simple Rating System Projection

POS PLAYER MIN LAST SEASON PPA SRS PROJECTED PPA PROJECTED kWins
PG John Wall 2812 139 143 8.3
C Marcin Gortat 2464 154 144 7.3
SG Bradley Beal 2325 96 111 5.3
SF Paul Pierce 1800 139 117 4.3
SF Otto Porter 1800 15 63 2.3
PF Kris Humphries 1608 132 133 4.4
F/C DeJuan Blair 1450 97 135 4.0
PF Nene Hilario 1430 102 102 3.0
PG Andre Miller 1165 86 108 2.6
G/F Glen Rice 1029 20 82 1.7
F/C Drew Gooden 1002 106 118 2.4
G/F Martell Webster 1000 77 102 2.1
G/F Rasual Butler 0 63 81 0.0
C Kevin Seraphin 0 35 53 0.0
G Garrett Temple 0 24 54 0.0
POS TEAM 19885 107 117 47.9

The guys over at Basketball-Reference have up Simple Rating System projected stats for everyone who played in the NBA last season. Go here for an explanation. They don’t estimate minutes, which I can understand because it’s frigging hard to do.

The SRS approach is more optimistic than the one I used — at least at the bottom line. SRS generally predicts less of a decline for older players, but also not as much improvement from the younger ones. The SRS approach would suggest the Wizards will win 48 games this season — with a low end prediction of 43 and a high of 52.

Here’s a table comparing results from the two approaches:

POS PLAYER DOPP PPA SRS PPA DOPP kWINS SRS kWINS
PG John Wall 156 143 9.0 8.3
C Marcin Gortat 132 144 6.7 7.3
SG Bradley Beal 112 111 6.1 5.3
SF Paul Pierce 108 117 4.0 4.3
SF Otto Porter 85 63 3.2 2.3
PF Kris Humprhies 133 133 4.4 4.4
F/C DeJuan Blair 97 135 2.9 4.0
PF Nenê 90 102 2.7 3.0
PG Andre Miller 65 108 1.6 2.6
G/F Glen Rice Jr. 78 82 1.2 1.7
F/C Drew Gooden 100 118 2.1 2.4
G/F Martell Webster 74 102 1.5 2.1
G/F Rasual Butler 55 81 0.0 0.0
C Kevin Seraphin 49 53 0.0 0.0
G Garrett Temple 33 54 0.0 0.0

DOPP PPA = projected PPA using the Statistical Doppelganger approach

SRS PPA = projected PPA using the Simple Rating System numbers published by Basketball-Reference

DOPP kWINS = projected individual wins contributed using the Statistical Doppelganger approach

SRS kWINS = projected individual wins contributed using the Simple Rating System numbers published by Basketball-Reference

Final Word

In the end, I’m using my own projection system. Last year, I projected the Wizards would win 43 — they won 44, albeit not exactly in ways that I expected. I’ve refined my projection system (I hope), although I’m hoping the team outperforms my prediction by a wide margin.

While still lacking an elite producer, the Wizards could be a tough out in the playoffs when rotations shorten and there’s more rest between games (especially in the first round). If they can get there healthy, of course.

I’m projecting the Wizards will win between 41 and 48 games this season. Final projection: 45 wins and the fifth seed in the Eastern Conference playoffs.

Wizards Doppelgangers: The Enigmas

otto porter

In case you missed them, I’ve done two installments using my Statistical Doppelganger Machine to look at the player seasons most similar to Wizards (similar production at similar age):

Here’s a look at low-minute Wizards for whom finding comps was challenging because of their scant playing time: Otto Porter, Glen Rice Jr., and Garrett Temple.

Let’s start with the guy likely to play the biggest role for the team this season: Porter.

PLAYER POS SEASON AGE TEAM SIM SCORE PPA SEASON PPA PEAK
Otto Porter SF 2013-14 20 WAS 100 15 15
Lance Stephenson SG 2011-12 21 IND 87 14 116
Cory Joseph SF 2011-12 20 SAS 86 18 94
Jumaine Jones SF 2003-04 24 BOS 86 24 98
Quincy Pondexter SF 2010-11 22 NOH 86 38 67
Shawne Williams SF 2006-07 20 IND 85 39 53
Kareem Rush SG 2002-03 22 LAL 85 3 53
Brandon Bass PF 2005-06 20 NOK 85 37 116
Kevin Martin SG 2004-05 21 SAC 84 32 162
Kedrick Brown SF 2002-03 21 BOS 84 44 97
Gerald Henderson SG 2009-10 22 CHA 84 36 99

Wizards fans know Porter had what amounts to a lost rookie season. He missed training camp with a hip injury, barely played, and was terrible when he did play. When I post my projections Wednesday, I’ll go through a couple different ways I dealt with predicting his performance, but the exercise today is NBA similars.

The list of similars was something of a pleasant surprise. It’s basically a list of players who had a disastrously bad season and then (for the most part) went on to become contributors. That said, “contributors” is a broad term. As a group, Porter’s similars tended to peak young (average age 23.4) and low (average peak PPA: 88). But, they all improved the following season — generally by a bunch.

And, the list includes Kevin Martin, who’s been a good player for nearly a decade, and Lance Stephenson who became an above average performer this season — and is likely to continue improving.

PLAYER POS SEASON AGE TEAM SIM SCORE PPA SEASON PPA PEAK
Glen Rice Jr. SG 2013-14 23 WAS 100 20 20
Scott Padgett PF 1999-00 23 UTA 90 20 96
Will Barton G/F 2012-13 22 POR 87 28 60
Quincy Douby SF 2006-07 22 SAC 86 34 34
Orlando Johnson SG 2012-13 23 IND 85 60 60
Reggie Jackson G 2011-12 21 OKC 84 32 101
Bostjan Nachbar SF 2003-04 23 HOU 84 24 84
Ronnie Price G 2006-07 23 SAC 84 40 54
Thabo Sefolosha SG 2006-07 22 CHI 84 31 129
Nolan Smith G 2011-12 23 POR 84 10 10
Kevin Brooks SF 1992-93 23 DEN 84 18 34

While Porter’s comps were somewhat comforting, it’s difficult to say the same about Rice’s. Like Porter’s list, Rice’s similars tended to peak early (average age: 24.0), but even lower (average peak PPA: 62). But, Will Barton and Reggie Jackson are both still works in progress. And, a few more had a productive season or two in which they helped their team, and one (Sefolosha) became a decent role-playing starter.

All that said, Rice played just 109 total minutes last season. The players who performed like him (similar age, similar production) isn’t a list all-time greats, but that shouldn’t be expected from a second round pick. There’s little reason to think Rice will be unable to work himself into being a contributor.

PLAYER POS SEASON AGE TEAM SIM SCORE PPA SEASON PPA PEAK
Garrett Temple G 2013-14 27 WAS 100 24 60
Rick Carlisle G 1985-86 26 BOS 89 28 28
Pace Mannion SF 1987-88 27 MIL 88 30 61
Pace Mannion SF 1983-84 23 GSW 88 32 61
David Wingate SG 1994-95 31 CHH 88 32 89
Dudley Bradley SG 1985-86 28 WSB 86 60 102
Jason Hart PG 2005-06 27 SAC 86 13 119
Ronnie Price PG 2012-13 29 POR 86 14 54
Randy Brown PG 1995-96 27 CHI 86 50 86
Royal Ivey PG 2006-07 25 ATL 86 38 38
Reece Gaines PG 2003-04 23 ORL 85 11 20

Temple may have been the most difficult player to project because so many of the guys who produced like he did last season didn’t have a follow-up year. In other words, the league took a collective look at players like Temple, and decided to sign Someone Else.

Players like Temple peaked low (average peak PPA: 65) and fairly young (25.5). Two of the 10 most similar got significantly worse the following season, four got better, and four stayed about the same. The list certainly doesn’t offer much hope for improvement.

Later today: Bump and Bruise.

A Quick Look At Something (Hopefully) Devoid of Meaning

otto porter

The Wizards exhibition season has ended and they’re hopefully in the training rooms and rehabilitation gizmos trying to get healthy for their regular season opener against the Heat next Wednesday.

What does the preseason mean? Roland Beech, then proprietor of 82games.com (and now working for the Dallas Mavericks) ran some correlations a few years back. His findings suggest that preseason provides some indication of a team’s regular season fortunes, but that the previous season’s winning percentage remains a better barometer.

Beech’s numbers showed the preseason matters most to teams who stunk the previous year. The strongest correlations between preseason record and regular season record were between teams that won 30 or fewer games the previous year. Second strongest were for teams winning 40 to 49 games (hello, Wizards).

The Wizards, of course, are going to be on the “preseason doesn’t matter” side of this discussion considering they were 11th in the Eastern Conference in preseason efficiency differential and 29th in offensive efficiency. The league scored 101.8 points per 100 possessions in the preseason; the Wizards scored 95.0.

On the bright side, Washington boasted the league’s 8th best defensive rating.

Below are the preseason estimated Player Production Averages (PPA) for Wizards who played at least 50 minutes. PPA is an overall rating metric I developed that credits players for things they do that help a team win, and debits them for things that don’t. It’s a per-minute stat that’s pace-neutral, (normally) accounts for defense, and (normally) includes a “degree of difficulty” factor based on the level of competition a player faces while on the floor. In PPA, 100 = average, higher is better, and (normally) 45 = replacement level.

I use “normally” in a few spots because the data necessary to calculate a player’s defensive contributions and/or the degree of difficulty factor aren’t available in the preseason. Plus, I don’t know if there can be such a thing as “replacement level” in the preseason.

PLAYER GMS MPG ePPA
james,damion 5 12.6 188
silas,xavier 3 17.7 145
porter,otto 7 26.6 110
miller,andre 6 18.3 96
temple,garrett 7 19.7 91
hilario,nene 5 19.4 90
wall,john 6 25.8 82
gortat,marcin 7 27.4 71
pierce,paul 5 19.6 51
seraphin,kevin 7 21.9 52
rice,glen 4 22.3 46
butler,rasual 5 15.6 32
blair,dejuan 7 21.3 -3
beal,bradley 3 20.7 -38

Do NOT use these numbers to make bold predictions or sweeping pronouncements. These represent a tiny sample size — a sample in which many players are basically going through the motions at least some of the time — and are presented just as a general barometer for how players performed in the preseason.

Looking back at last year’s preseason numbers and see that Bradley Beal had an outstanding preseason, but wasn’t as good in the regular season. Meanwhile, Trevor Ariza and John Wall were bad in exhibition games, but good in real ones. Some guys were about the same in both — Jan Vesely, Al Harrington, Eric Maynor, Kevin Seraphin and Garrett Temple.

This year…most of the team’s rotation players were unproductive. Wall had an ePPA below 20 most of the preseason until he had a good performance against the Knicks. Seraphin may yet have that breakout season so many are hoping for, but ended his preseason in the same general territory where he’s spent most of his young career.

The team’s bright spot in the preseason was Otto Porter. He was a little above average — encouraging progress from a second year player who was mostly overwhelmed as a rookie.

Now…real games.

Wizards Slouching Toward the Playoffs

The numbers in the table below are this week’s Player Production Average (PPA) update. PPA is a metric I developed that credits players for things that contribute to winning and debits them for things that don’t — each in proper proportion. PPA is pace adjusted, accounts for defense and includes a degree of difficulty factor. In PPA, 100 = average, higher is better and 45 = replacement level. PPA is a per minute stat.

PLAYER GMS MPG LW PPA
Marcin Gortat 77 32.9 150 153
Trevor Ariza 73 35.7 151 143
John Wall 78 36.6 141 138
Trevor Booker 68 21.4 115 119
Drew Gooden 20 18.6 127 114
Nene Hilario 50 29.9 101 100
Andre Miller 24 14.4 104 91
Bradley Beal 69 34.7 89 89
Martell Webster 74 28.1 82 80
Jan Vesely 33 14.2 68 68
Kevin Seraphin 50 11.4 35 37
Chris Singleton 24 10.4 34 32
Garrett Temple 71 8.9 25 25
Glen Rice 11 9.9 20 20
Otto Porter 33 8.2 13 19
Al Harrington 30 14.9 13 8
Eric Maynor 23 9.3 8 8

Rough week for the Wizards, which is reflected in the individual numbers. On the positive side were Marcin Gorat, (who continues to have a good season), Trevor Booker (who many fans want removed from the rotation), and Otto Porter (who performed better, but still rates well below replacement level).

Even with a bad week, Trevor Ariza is having a career season. He gets a bit of a pass for the last few games — he’s been beset with the flu, and really shouldn’t have even been on the floor.

John Wall’s production fell for a third straight week. It’s been fashionable to celebrate Wall’s improvement and his ascendancy to All-Star status, but it’s worth noting that his 138 PPA this season is virtually identical to the 139 he posted last year.

Here’s a visualization of each player’s PPA through the season. Since this is basically a weekly rolling season average, the larger fluctuations at the beginning followed by a flatter line toward the end is to be expected. Note the fairly steady climb of Gortat’s PPA — he’s been playing better as the season has progressed. The production slip from Wall the past three weeks is also apparent.

Check out the steady production from Booker. Webster’s season-long decline is apparent in his graph.

Drew Gooden’s production has fallen steeply after a hot start. He may not be the godsend Wizards fans had hoped for. Andre Miller’s play has been up and down, but at least sorta trending up.

ppa trend

Wizards Weekly: Playoffs Clinched

wall past carmelo

Since the Wizards cemented a spot in this year’s playoffs, I’m going to focus more on the stellar play of Trevor Ariza and Marcin Gortat, and sorta gloss over the things that bug me a bit in this week’s numbers.

Some positives:

  • Al Harrington had a good enough week that he no longer rates as the league’s least productive power forward. That honor belongs to Brandon Davies.
  • Marcin Gortat’s PPA rose to 150 — the highest its been since December 11.
  • I missed it last week, but the Wizards have no one with a negative PPA. The team’s least productive player is Eric Maynor, but he’s not in the NBA after being released by Philadelphia.
  • Otto Porter scored nine points in five minutes, and added 10 points to his PPA.

Below is this week’s Player Production Average (PPA) update. PPA is a metric I developed that credits players for things that contribute to winning and debits them for things that don’t — each in proper proportion. PPA is pace adjusted, accounts for defense and includes a degree of difficulty factor. In PPA, 100 = average, higher is better and 45 = replacement level. PPA is a per minute stat.

PLAYER GMS MPG LW PPA
Trevor Ariza 70 35.7 151 151
Marcin Gortat 74 32.7 145 150
John Wall 75 36.6 144 141
Drew Gooden 17 18.9 148 127
Trevor Booker 65 21.0 116 115
Andre Miller 21 14.8 81 104
Nene Hilario 49 30.1 101 101
Bradley Beal 66 34.5 90 89
Martell Webster 71 28.2 81 82
Jan Vesely 33 14.2 68 68
Kevin Seraphin 49 11.5 36 35
Chris Singleton 23 10.7 40 34
Garrett Temple 69 9.1 22 25
Glen Rice 11 9.9 20 20
Al Harrington 28 15.5 1 13
Otto Porter 32 8.2 3 13
Eric Maynor 23 9.3 8 8

Okay, I can’t help myself — now for the stuff that worries me:

  • Wall’s PPA is down to 141. That’s a good score, but his PPA last season was 139. And his offensive efficiency has slipped back below average.
  • Gooden’s PPA dropped sharply this week. His efficiency numbers are still insanely good — heck, all his numbers are, except for defense. There are way too many defensive breakdowns when he’s on the floor, and he continues to lose points in the defense portion of PPA.
  • Beal and Webster both rate solidly below average. This isn’t a surprise — Beal’s still a kid trying to figure out his spot in the league, and Webster is basically regressing to his mean this season. But, it does mean the Wizards aren’t getting a ton of production from their SG — and both rate as below average defenders.


The Briefest of Wizards Updates

In keeping with established Wizards traditions, Al Harrington is currently the NBA's least productive PF.
In keeping with established Wizards traditions, Al Harrington is currently the NBA’s least productive PF.

Don’t have a ton of time for fancy prose — not with friend of the blog Ben Becker inviting himself to be a guest blogger next week and filling my inbox with questions.

So…here’s this week’s Player Production Average (PPA) update. PPA is a metric I developed that credits players for things that contribute to winning and debits them for things that don’t — each in proper proportion. PPA is pace adjusted, accounts for defense and includes a degree of difficulty factor. In PPA, 100 = average, higher is better and 45 = replacement level. PPA is a per minute stat.

PLAYER GMS MPG LW PPA
Trevor Ariza 66 36.0 154 151
Drew Gooden 13 17.5 152 148
Marcin Gortat 70 32.9 147 145
John Wall 71 36.8 146 144
Trevor Booker 61 21.1 116 116
Nene Hilario 49 30.1 103 101
Bradley Beal 62 34.4 88 90
Andre Miller 17 14.3 75 81
Martell Webster 67 28.4 84 81
Jan Vesely 33 14.2 69 68
Chris Singleton 22 11.0 40 40
Kevin Seraphin 47 11.8 40 36
Garrett Temple 66 9.4 23 22
Glen Rice 11 9.9 21 20
Eric Maynor 23 9.3 8 8
Otto Porter 31 8.3 3 3
Al Harrington 24 15.0 -2 1

Unsurprisingly given the team’s record during their recent series against the Western Conference, the production of their top players was down a little across the board. Nothing major — just…the kind of thing to be expected when they face some tougher competition than they get in the East.

I don’t know how much Martell Webster’s back is bothering him, but his production is way down this season. Last season, he posted a career-best PPA of 114. This season, he’s back down at his career level. This is cause for concern.

Also, I’ve heard/seen folks in a variety of places refer to the Wizards as a “young team.” But….not so. They’re right at the league average in age, but their rotation at this point is older. I’ll probably look at this in greater detail next week, but consider this:

  • The team’s plan was “build through the draft,” but only three of their rotation players (Wall, Beal and Booker) were selected by the Wizards.
  • Those same three players are the team’s only rotation players younger than league average.
  • Once Nenê returns they’ll have more rotation guys age 30 or older (four) than they do under age 26 (three).

The team does have young players on the roster, but they’ve been decidedly unproductive this season — for much of their careers for most of them.

In keeping with Wizards tradition, Al Harrington currently rates as the NBA’s least productive PF (minimum 300 minutes). Last season, that title was held by Jan Vesely.