The Washington Wizards have embarked on a major renovation of their offense, and while the results are decidedly mixed through their first six games, the right thing is to stay the course and see if players can grow into new roles.
Last season, the Wizards were 18th in pace and 28th in three-point attempt rate (the percentage of field goal attempts from three-point range). So far in 2015-16, they’re second in pace (a whopping 8.4 possessions per 48 minutes faster) and 12th in three-point attempt rate.
The positives so far: decent shooting and an uptick in trips to the free throw line. The negatives: the league’s worst turnover rate, a drop-off in rebounding effectiveness, and an elevated opponent shooting percentage.
While patience is warranted as the team figures out how to operate in the new system, the emphasis on playing at a fast pace continues to be a concern for me. Why? Because pace of play has nothing to do with what causes teams to win games. Go through the record of games and seasons, and you’ll find good (and bad) teams that played fast, slow and in-between. What makes sense is for a team to play at a pace where it’s comfortable, where the players are under control, and where it can get good shots and maximize efficiency. If that’s fast, then play fast. If it’s slower, then slow down.
At the risk of oversimplifying, basketball is a game where teams take turns with the ball until the clock runs out. The number of possessions are about the same for each team over the course of a game — sometimes there’s a possession or two variance based on end-of-period exchanges. Playing fast doesn’t get a team extra possessions because no matter how quick they shoot the ball, the other team gets it back. What matters is efficiency — generating more points on your possessions than the other guy does on his.
The emphasis on playing fast — at least as it’s been implemented by the Wizards so far — seems misguided to me. Pushing the ball up the floor every possession is a good strategy because it can stress the defense, catch defenders out of position, and give Washington more time to run its half court offense. But if rushing leads to more turnovers, and weakened defensive rebounding, the strategy is missing the point.
What really concerns me about the “play fast” mantra is the question of whether the Wizards truly have a grasp on what’s important for a team to win. There’s a palpable feeling that they’re mimicking Golden State without a true understanding of why that style of play works for the Warriors, and how it fits Washington’s personnel. What wins games in the NBA? Doing these things better than the opponent (in order of importance): shooting from the floor, controlling turnovers, getting to the free throw line, and rebounding. Pace ain’t on the list.
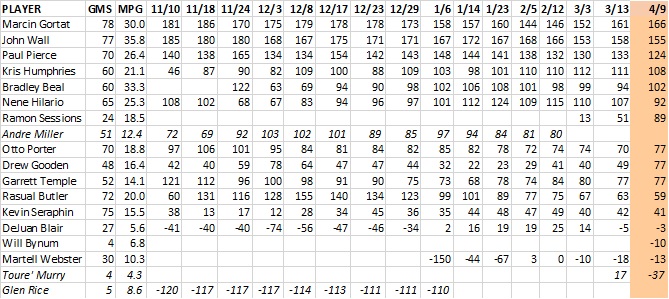
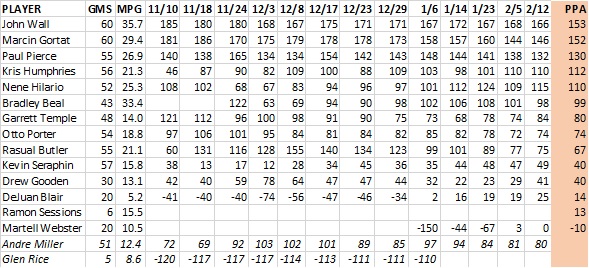
Player Production Average
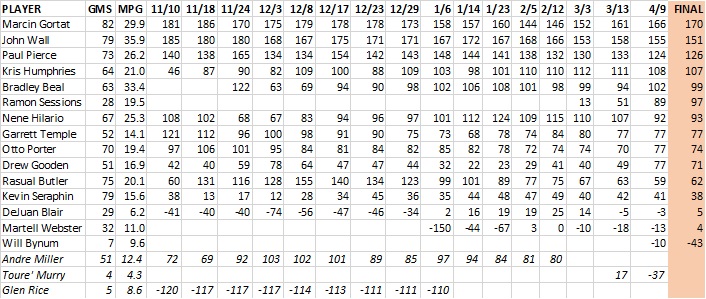
The ratings below are a metric I developed called Player Production Average (PPA). In PPA, players are credited for things they do that help a team win, and debited for things that don’t, each in proportion to what causes teams to win and lose. PPA is pace neutral, accounts for defense, and includes an adjustment based on the level of competition faced when a player is on the floor. In PPA, average is 100, higher is better, and replacement level is 45.
| PLAYER | GAMES | MPG | PPA |
| John Wall | 6 | 34.8 | 153 |
| Otto Porter | 6 | 34.0 | 144 |
| Ramon Sessions | 6 | 17.2 | 131 |
| Bradley Beal | 6 | 34.7 | 128 |
| Drew Gooden | 4 | 15.0 | 99 |
| Marcin Gortat | 6 | 28.0 | 91 |
| Kris Humphries | 6 | 20.5 | 90 |
| Nene Hilario | 6 | 18.0 | 58 |
| Garrett Temple | 4 | 3.5 | 38 |
| Jared Dudley | 5 | 21.6 | 36 |
| Gary Neal | 6 | 17.7 | 23 |
| Kelly Oubre | 3 | 5.3 | -103 |
| DeJuan Blair | 2 | 6.0 | -345 |
In many ways, I find these numbers (drawn from a small sample size) encouraging. The team’s most productive players so far are its youthful trio of high draft picks: John Wall, Otto Porter, and Bradley Beal.
It’s hard to believe veterans like Marcin Gortat and Jared Dudley will continue playing this poorly. Look for Nenê’s production to improve some as well.
On the other hand, don’t expect big jumps in productivity from DeJuan Blair (who apparently has forgotten how to play basketball), Gary Neal and Garrett Temple.
Also, much as I hate to write it, I think Porter’s PPA is ripe for a drop-off. It’s not likely he’ll continue to shoot 70% from two-point range or have a 60-plus percent efg.