Wizards Update: All-Star Edition

Wall all star

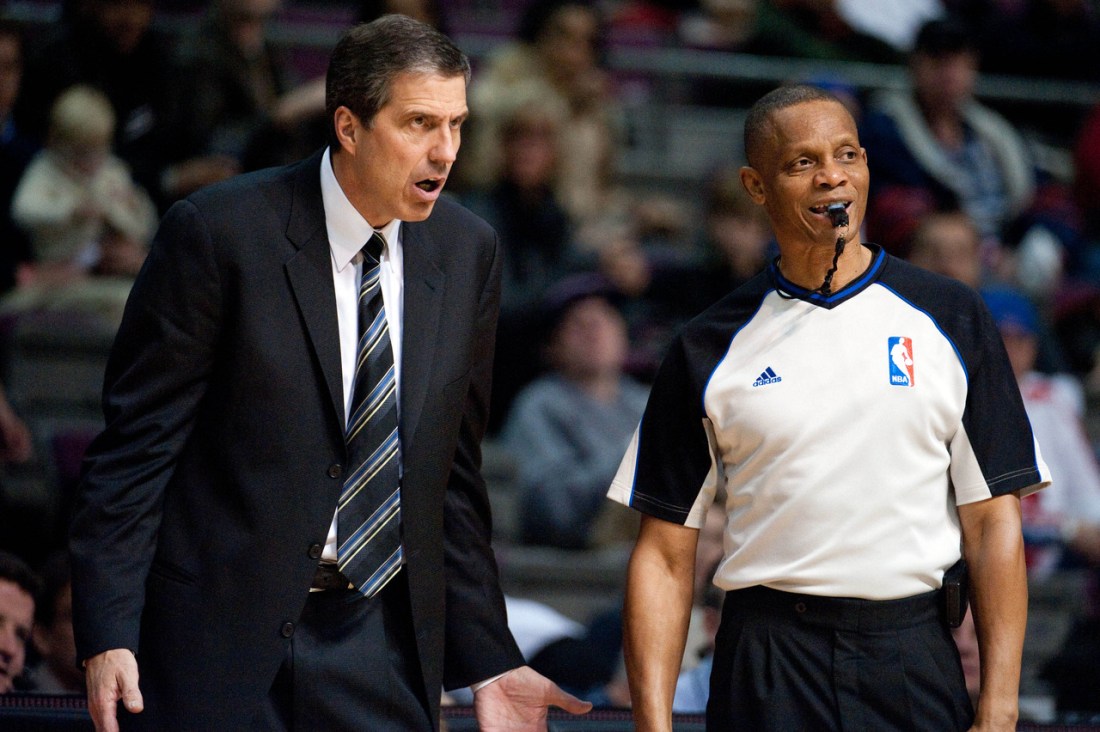
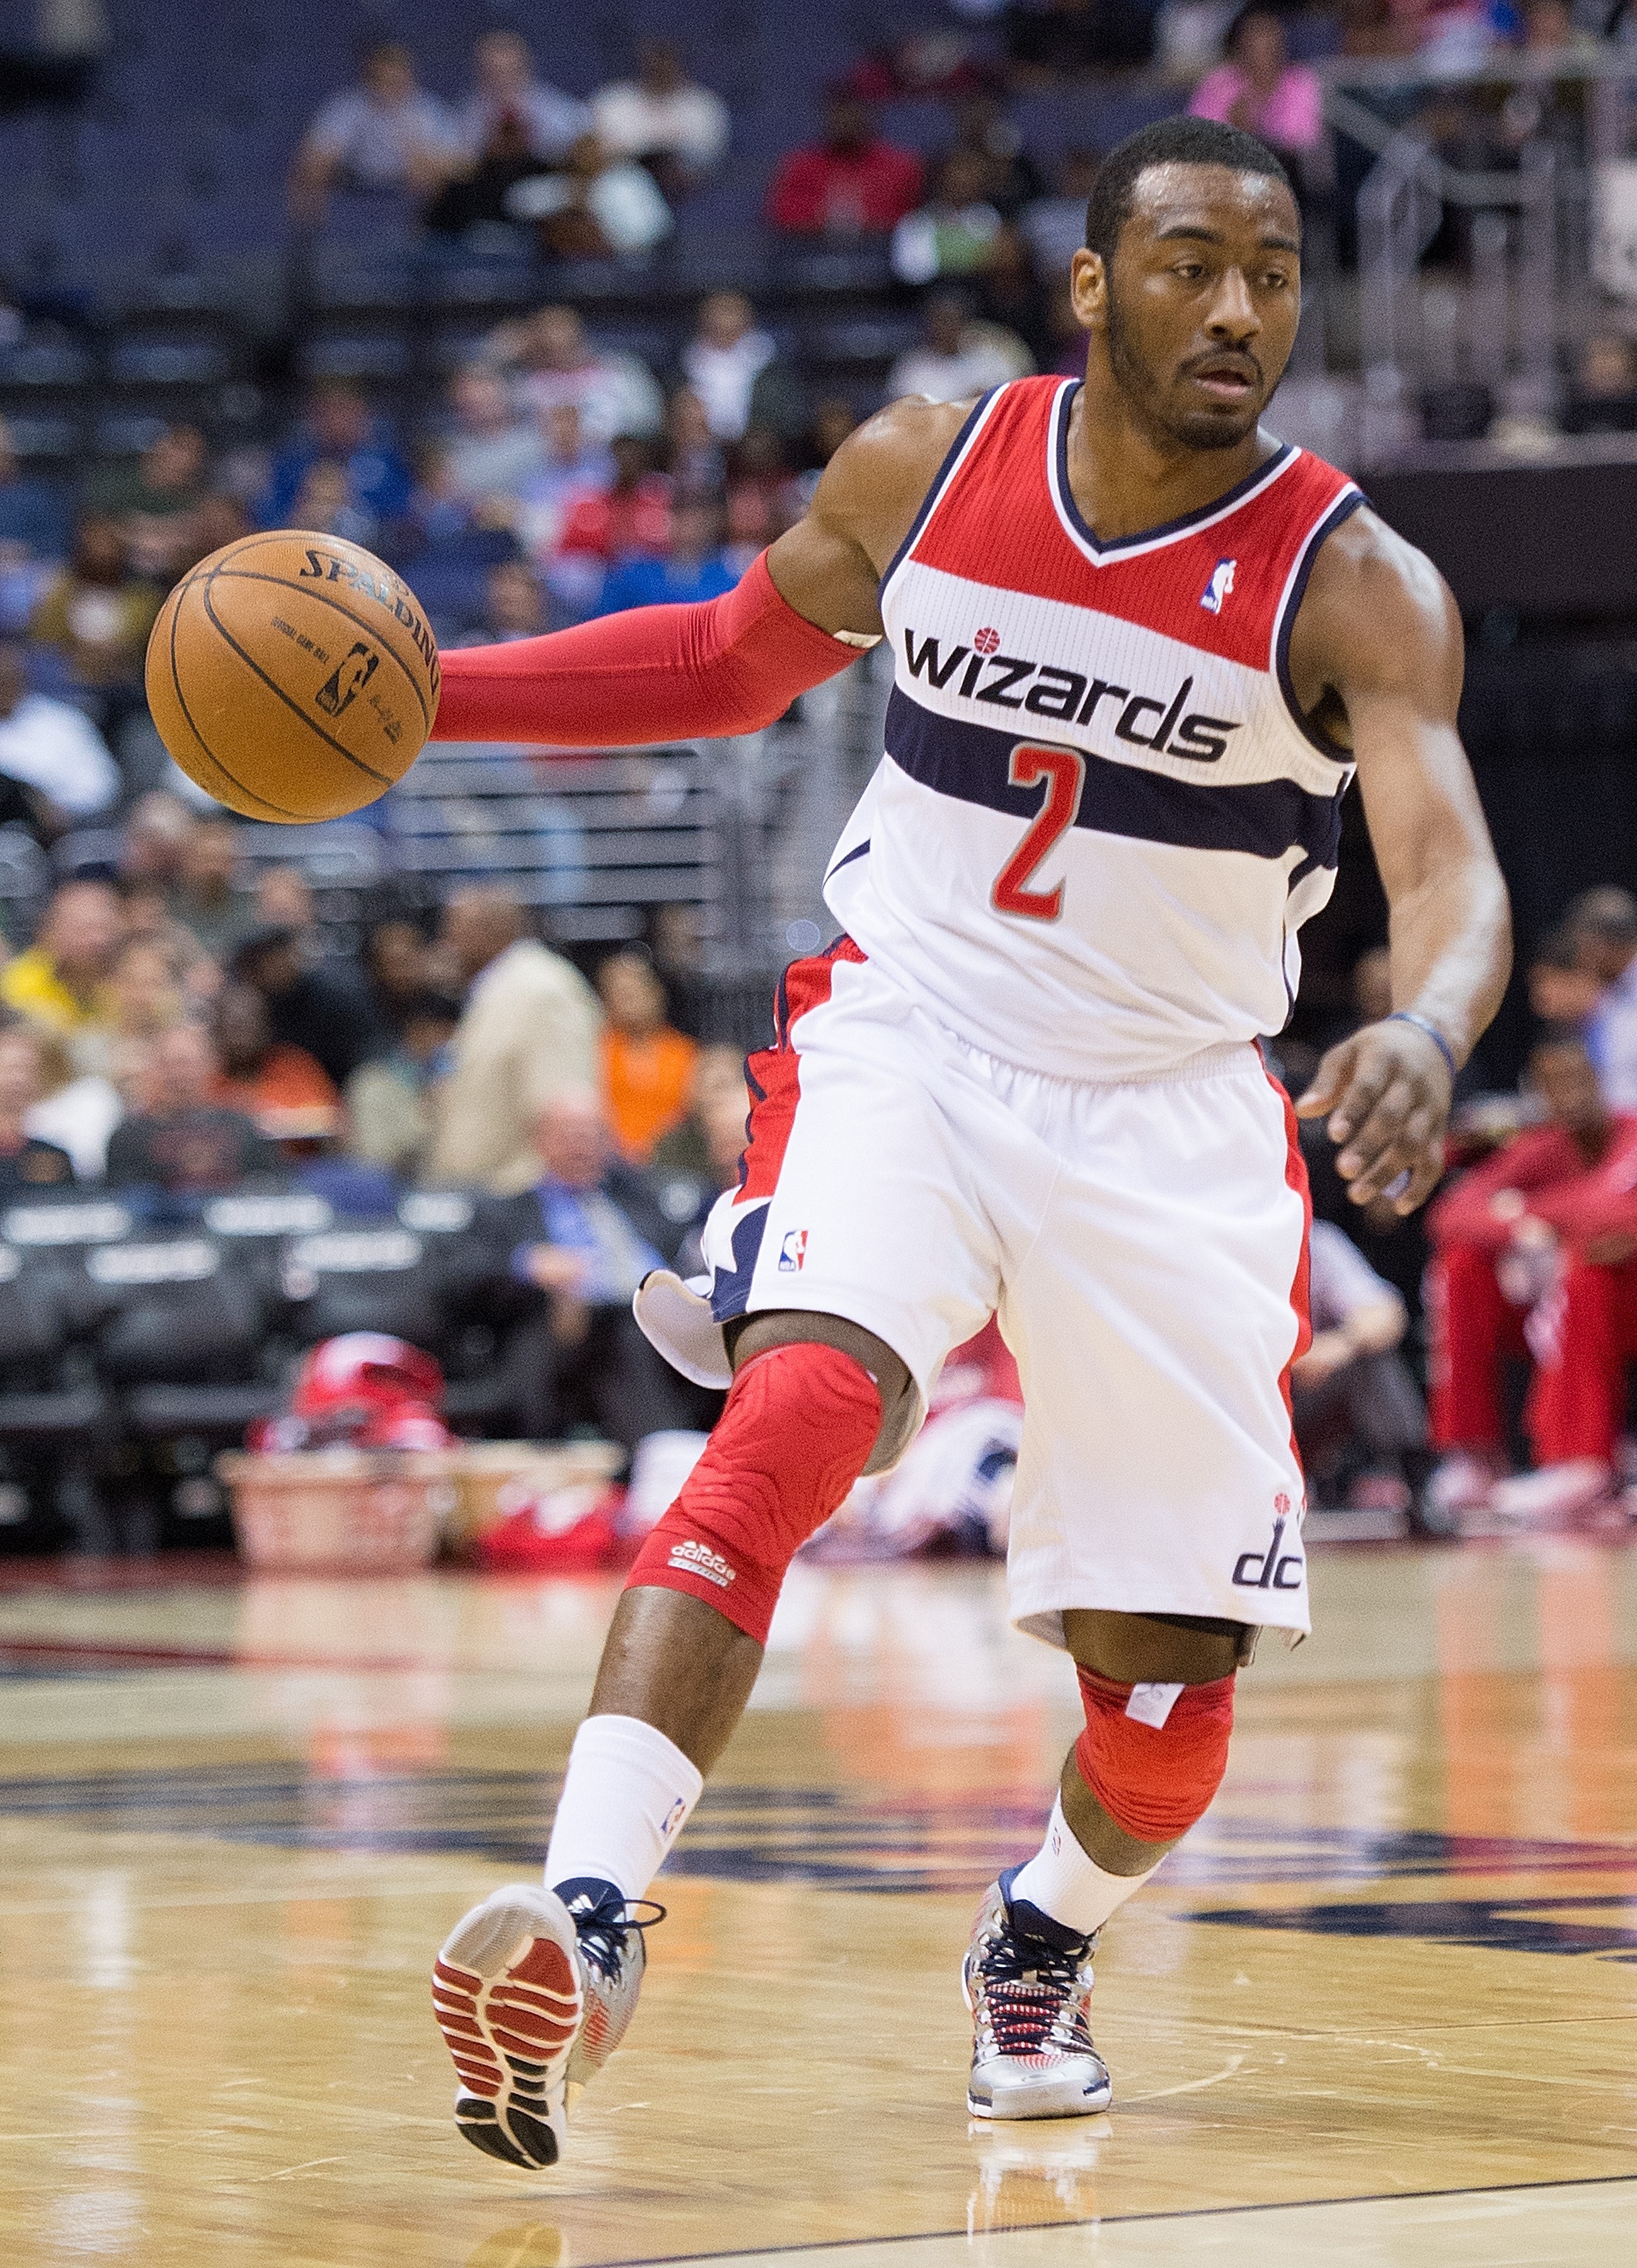
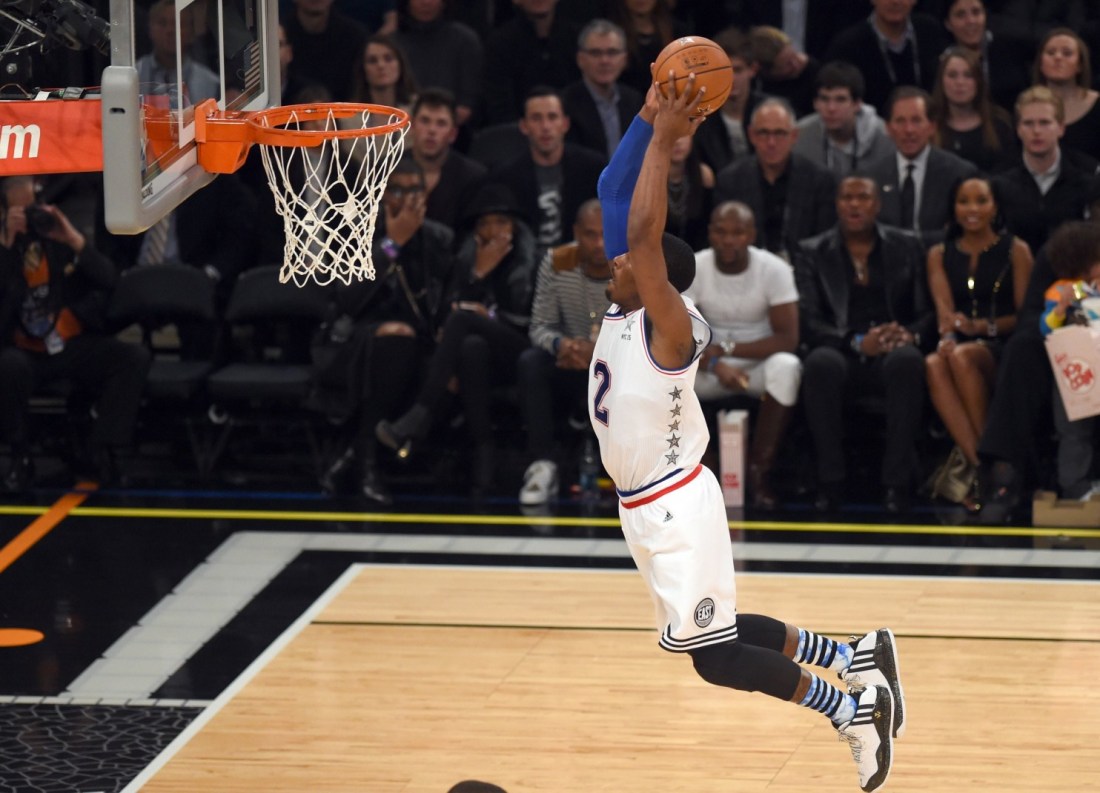
All-Star rosters will be released tonight, and while Wizards point guard John Wall will likely be selected, he’s borderline at best, and wouldn’t make the team if I was making the picks. I’ve looked at the numbers several different ways — total production, per game production, per minute production — and Wall remains just on the fringes of the All-Star roster.

This is in no small part because of the fan vote, which picked the starters in each conference. In the East,  at least according to my analysis, Dwyane Wade, Paul George and Carmelo Anthony are undeserving of All-Star status — even as reserves. This pushes all guards down one spot, and all front-court players down two. In my analysis, the next guard up for the East: John Wall. The next front-court guys: Greg Monroe and Al Horford.

In the West, the only poor choice was Kobe Bryant, who received a career achievement honorific. The next deserving front-court player was Blake Griffin, whose injury would have pushed to next man up Dwight Howard.

Here’s the way Player Production Average (my metric, see below) would divvy up the teams:

POS EAST WEST
G Kyle Lowry Stephen Curry
G Dwyane Wade Russell Westbrook
F Lebron James Kobe Bryant
F Paul George Kevin Durant
F Carmelo Anthony Kawhi Leonard
G Jimmy Butler Chris Paul
G Kemba Walker James Harden
F Paul Millsap Draymond Green
F Hassan Whiteside Anthony Davis
F Andre Drummond DeAndre Jordan
G Isaiah Thomas Damian Lillard
F Chris Bosh Derrick Favors

My guess is that Wall will probably be chosen over Walker and that Horford will make it over Whiteside. In the West, I’d anticipate Thompson over Lillard and Howard or Demarcus Cousins over Favors.

Those Mediocre Wizards

Talk about the Wizards potentially becoming trade deadline “sellers” inspired me to apply my “Real Trade Value” toy in an all-new way to measure the team’s pervasive mediocrity.

I haven’t written much about Real Trade Value, which is still a work-in-progress. RTV attempts to determine the trade value of each player in relation to the league’s MVP. In RTV, there’s accounting for age (younger players get a bonus; older players get a deduction), and total production and per minute production are given equal weight. So, RTV “likes” players who are young, productive and durable.

There’s no accounting (yet) for contract or position.

In RTV, the top value (this year it’s Stephen Curry) is set at 1,000. Other players are scaled beneath. The idea is similar to the NFL draft pick value sheet. A theoretical trade for Curry would cost 1,000 RTV points. Here are the players closest to each 100-point mark:

  • 1,000 — Stephen Curry
  • 900 — Kawhi Leonard
  • 800 — no one (here’s how outlandish Curry and Leonard have been: Curry’s RTV is 1,000; Leonard’s is 878; next closest is Westbrook at 721)
  • 700 — Russell Westbrook, Andre Drummond, Kevin Durant, Karl-Anthony Towns, Anthony Davis
  • 600 — Greg Monroe, Hassan Whiteside
  • 500 — Al Horford, Kevin Love, Derrick Favors, Paul George, Clint Capela, Chris Bosh
  • 400 — Zaza Pachulia, Mike Conley, C.J. McCollum, LaMarcus Aldridge, Enes Kanter
  • 300 — Ryan Anderson, Bismack Biyombo, T.J. McConnell, Jrue Holiday, Jeff Teague
  • 200 — Trevor Booker, Kyle Anderson, Frank Kaminsky, Jeremy Lin, Ramon Sessions
  • 100 — Mike Muscala, Jamal Crawford, E’Twaun Moore, Jameer Nelson, Kevin Martin
  • 0 — Vince Carter, Sasah Vujacic, Emmanuel Mudiay, Markieff Morris

Got all that? There’ll be a quiz later.

In terms of actual trade value, contracts and position almost certainly need to be included. But, for looking at franchise health — weighing productivity and health vs. age — it works reasonably well.

Here’s a table with the results, sorted by conference.

TEAM CONF NBA RANK CONF RANK FRANCHISE HEALTH INDEX
BOS E 5 1 77
ORL E 6 2 75
ATL E 7 3 74
TOR E 8 4 74
CLE E 10 5 71
MIL E 12 6 70
IND E 13 7 69
CHO E 14 8 69
WAS E 19 9 65
NYK E 20 10 65
DET E 21 11 64
MIA E 24 12 62
CHI E 25 13 62
PHI E 27 14 59
BRK E 28 15 59
GSW W 1 1 100
OKC W 2 2 89
SAS W 3 3 84
UTA W 4 4 78
NOP W 9 5 72
DEN W 11 6 70
HOU W 15 7 69
LAC W 16 8 69
POR W 17 9 68
MIN W 18 10 67
SAC W 22 11 63
PHO W 23 12 63
DAL W 26 13 61
MEM W 29 14 52
LAL W 30 15 52

The last column is a “franchise health” index where the top team (Golden State) is set at 100 and other teams are scaled below. The Wizards rank 19th overall and 9th in the East. League average “index” score is 69, indicating they rate a little below average.

IF this measure has any predictive value at the team level (and that’s a HUGE “if” because I’ve done precisely zero research on that question), the Wizards have significant work ahead of them to upgrade the roster.

Player Production Average

The ratings below are a from a metric I developed called Player Production Average (PPA). In PPA, players are credited for things they do that help a team win, and debited for things that don’t, each in proportion to what causes teams to win and lose. PPA is pace neutral, accounts for defense, and includes an adjustment based on the level of competition faced when a player is on the floor. In PPA, average is 100, higher is better, and replacement level is 45.

League-wide PPA scores through games played 01/27/16 are here.

PLAYER GMS MPG 11/10 11/22 12/3 12/13 12/21 12/30 1/6 1/13 1/27
Marcin Gortat 37 31.7 91 112 128 133 132 138 147 145 148
John Wall 43 35.7 153 129 136 168 157 157 149 144 142
Otto Porter 36 32.1 144 158 104 116 107 115 122 127 130
Jarell Eddie 11 6.9  –  –  –  –  – 153 119 113 110
Jared Dudley 42 28.7 36 92 90 85 98 103 100 105 99
Bradley Beal 22 32.9 128 108 96 87 87 86 85 86 98
Nene Hilario 22 18.4 58 90 80 74 79 78 79 88 92
Ramon Sessions 43 21.2 131 119 84 90 87 89 88 91 90
Garrett Temple 41 24.7 38 106 57 54 70 63 68 79 79
Kris Humphries 27 17.1 90 121 95 80 78 76 79 79 78
Gary Neal 35 21.1 23 49 64 75 78 74 75 78 71
Kelly Oubre 36 13.4 -103 -4 -40 -44 9 37 43 39 36
Drew Gooden 14 13.8 99 51 57 56 56 56 38 47 34
DeJuan Blair 26 7.9 -345 -129 -112 -45 -34 -38 -38 -28 -6
Ryan Hollins 5 9.6  –  – -40 60 59  –  –  –  –

The numbers aren’t too encouraging. Wall has followed up his Player of the Month December with a thoroughly meh January. If the Wizards are going to get back in contention for a spot in the playoffs, they need something closer to the December Wall than they’ve been getting.

Wizards Update: Level Best

It may seem strange to worry about the Wizards making the playoffs this season when they still have 49 games to play, but history suggests they’re already running out of time to turn things around and reach the postseason.

It’s likely going to take 45 wins to earn the eighth seed in this year’s East. With Washington at 15-18, simple math says they’ll need another 30 wins in their final 49 games. That means playing at about .600 level the rest of the way — basically at the level of a 50-win team (over an 82-game schedule).

This is possible and not unprecedented in basketball history. Teams have dramatically improved after a poor start. But not many of them. Teams that started a season like the Wizards were much more likely to remain at the same level than markedly improve. One of those teams (the 04-05 Denver Nuggets) made two coaching changes and played .800 ball (32-8) to finish the season with 49 wins. That record is a dreamworld best-case fantasy, though.

In the real world, last season’s Wizards actually began the year a 31-18 record in their first 49 games. That’s a .633 winning percentage, and if they could replicate it over the final 49 games of this season they’d end up with 46 wins and a berth in the playoffs. Last year in reverse has a patina of plausibility, which makes it seem more possible than the evidence indicates.

Unfortunately, there are several good reasons to think that quality of play is unlikely. Since that 31-18 start, the Wizards are 36-40 — 15-18 to finish 2014-15, 6-4 in the playoffs, and 15-18 this season. That’s the quality of a 37-win team across a BIG stretch (93% of a regular season). And it’s notably consistent.

In addition, the team’s scoring differential through that 49-game stretch suggested they weren’t quite as good as their record. Scoring differential analysis indicated a 28-win team during that stretch — about the level of a 46-win team over an 82-game schedule, not the 51-win level suggested by their 31-18 record. At 33 games last season, the team was 22-11 — about three wins ahead of their expected win total. The difference wasn’t an indication that the Wizards “knew how to win” or had become “clutch,” it was a signal that the team wasn’t as good as their record.

And here’s where things get even more worrisome for the 2015-16 edition of the Wizards: their scoring differential says they’re the quality of a 13-win team through their first 33 games. Their won/loss record is running about two games ahead of their expected wins. This is a sign of weakness. Widely perceived as under-performing, the team is actually playing even worse than their already bad record. Their winning percentage is that of a 37-win team over an 82-game schedule. Their scoring differential suggests they’re playing at the level of a 32-win team. Another way of looking at it: they’re 19th in winning percentage, and 22nd in scoring differential.

The task ahead of them is not impossible. They could improve, and they are just 2.5 games from the eighth seed. But it’s time for some urgency. It’s time for them to start playing at a higher level and to string together wins. Because with every additional loss, the goal of making the playoffs this season becomes less and less probable.

Player Production Average

The ratings below are a metric I developed called Player Production Average (PPA). In PPA, players are credited for things they do that help a team win, and debited for things that don’t, each in proportion to what causes teams to win and lose. PPA is pace neutral, accounts for defense, and includes an adjustment based on the level of competition faced when a player is on the floor. In PPA, average is 100, higher is better, and replacement level is 45.

League-wide PPA scores through games played 01/06/16 are here.

PLAYER GAMES MPG 11/10 11/22 12/3 12/13 12/21 12/30 PPA
John Wall 33 35.7 153 129 136 168 157 157 149
Marcin Gortat 30 31.2 91 112 128 133 132 138 147
Otto Porter 30 32.2 144 158 104 116 107 115 122
Jarell Eddie 5 11.6 153 119
Jared Dudley 32 27.8 36 92 90 85 98 103 100
Ramon Sessions 33 21.3 131 119 84 90 87 89 88
Bradley Beal 17 36.5 128 108 96 87 87 86 85
Kris Humphries 27 17.1 90 121 95 80 78 76 79
Nene Hilario 13 17.0 58 90 80 74 79 78 79
Gary Neal 25 22.1 23 49 64 75 78 74 75
Garrett Temple 31 22.8 38 106 57 54 70 63 68
Ryan Hollins 5 9.6     -40 60 59 59 59
Kelly Oubre 26 13.4 -103 -4 -40 -44 9 37 43
Drew Gooden 7 11.6 99 51 57 56 56 56 38
DeJuan Blair 18 8.4 -345 -129 -112 -45 -34 -38 -38

Wall’s season has been…odd. He was mediocre through the first month of the season, posting a PPA of just 94. When the calendar shifted to December, he abruptly transmogrified into an All-NBA caliber point guard, posting a December PPA of 202. Then in January, he’s posted three straight crummy games, and has a PPA of just 86. His wildly vacillating performance level gives ample ammunition to fans who believe he should be starting the All-Star game (look at the sensational play in December), as well as those who think other players are more deserving (look at the bad first month of the year). In PPA, he’s a borderline All-Star candidate — fifth among guards in the East (minimum 750 minutes), but with frontcourt players rated ahead of him.

History Hates This Year’s Wizards

USP NBA: WASHINGTON WIZARDS AT DETROIT PISTONS S BKN USA MI

NBA history has a few things to say about the Wizards, but not much of it is encouraging. Washington could radically improve — there are teams that started similar to the Wizards and got better — but the most likely outcome is a losing record, a trip to the lottery, and the possibility of a coaching change.

Combing through the archives at Basketball-Reference produced 39 teams since 1985-86 that had an efficiency differential through their first 32 games similar to Washington’s -3.2. Records varied from a high of 17 (two teams) to a low of 10 (six teams). The group average 12.9 wins — trailing Washington’s 15, but right in line with their expected wins (based on scoring differential).

Some teams like the Wizards (to the same point in the season) went remarkably different directions. At the low end are the 2012-13 Magic, which started 12-20 and managed just eight wins the rest of the season.

At the other extreme are the 2004-05 Nuggets, which started 14-18, fired head coach Jeff Bzdelik, and then finished out the year on a 32-8 run after hiring George Karl. The Nuggets earned the 7th seed in the playoffs, and lost in the first round.

Just 10 of the 39 teams finished with a record of .500 or better. Only four finished the season with a positive schedule-adjusted scoring differential.

On average, the group finished with 33.8 wins and a schedule-adjusted scoring differential of -2.62. Teams like the Wizards did improve, but only by about 0.8 wins per 82 games. Ten teams made the playoffs, but only one (the 2001-02 Charlotte Hornets) could win a series.

Ten teams fired coaches mid-season, but there was no better/worse trend from the changes. Some teams got better after a coaching change; some got worse. Twelve teams made coaching changes after the season. Six teams fired coaches mid-season, AND made a coaching change after the season.

Teams like the Wizards on average:

  • Record: 33.8-48.2
  • Average schedule-adjusted scoring differential: -2.62
  • .500 or better winning percentage: 26%
  • Average conference finish: 10.3
  • Made playoffs: 26%
  • Won a playoff series: 3%
  • In-season coaching change: 26%
  • Post-season coaching change: 31%

Three teams were 15-17 after their first 32 games with an efficiency differential about the same Washington’s. Only one of those teams made the playoffs (the 1992-93 Atlanta Hawks). The Hawks finished 43-39, got the 7th seed, and lost in the first round. After the season, they replaced Bob Weiss with Lenny Wilkens and won 57 games.

The other 15-17 teams — the 2008-09 New Jersey Nets, and the 1994-95 Dallas Mavericks — finished with 34 and 36 wins respectively. Both missed the playoffs, and neither made a coaching change.

Barring significant improvement from the Wizards, the most likely outcome is 35-38 wins and a scoring differential of around -2.0. While Washington is only 2.5 games out of 8th place in the East, it will probably take 44-45 wins. And they have to pull ahead of four other teams in contention for that spot.

There’s still 50 games remaining in the season, so there’s definitely still time for the Wizards to turn things around and salvage the season. Unfortunately, it’s rare for teams that started a year like them to have a happy ending.

Wizards Update: A Silver Lining

As if the 2015-16 Wizards season wasn’t crummy enough, the team released news over the weekend that Bradley Beal would miss at least a couple weeks with yet another stress reaction in his leg. While this was a bummer of a development — especially when combined with Beal’s fourth consecutive season of pedestrian production — I’m writing today not to induce depression, but to give hope.

Wizards point guard John Wall began the season well: after a strong performance against the Spurs, Wall’s PPA (see below) sat at a heady 184 — not an MVP candidate, but probably in the conversation for All-NBA, and definitely All-Star level.

And then, for some reason (possibly a previously undisclosed ankle injury) his production tanked. After four consecutive good-to-great games to start the year, eight of his next ten games rated below average in PPA. In two of the games (at Boston and home against Toronto), Wall rated a net negative; a scary place for the team’s star. After posting a -70 vs. the Raptors, Wall’s PPA for the season stood at a slightly below average 96.

And then…the calendar switched to December and Wall abruptly began playing like an MVP candidate. In the eight games since that -70, Wall has produced a PPA of 300 or better four times, and another three better than 200. His lone dud was a 74 against Phoenix.

Wall’s PPA for October and November was 96. In December: 278. For context, here are the top five full-season PPA scores on record:

  1. Lebron James, MIA, 2012-13 — 282
  2. Stephen Curry, GSW, 2014-15 — 277
  3. Lebron James, CLE, 2008-09 — 275
  4. Michael Jordan, CHI, 1990-91 — 268
  5. Lebron James, CLE, 2009-10 — 267

Now, even posting a 278 the rest of the way won’t get Wall into this year’s MVP conversation because Curry’s PPA is another 70 points better, but still. Wall has been playing great the past couple weeks, and seems to be turning his season around. That’s a genuine reason for optimism.

Player Production Average

The ratings below are a metric I developed called Player Production Average (PPA). In PPA, players are credited for things they do that help a team win, and debited for things that don’t, each in proportion to what causes teams to win and lose. PPA is pace neutral, accounts for defense, and includes an adjustment based on the level of competition faced when a player is on the floor. In PPA, average is 100, higher is better, and replacement level is 45.

League-wide PPA scores through games played 12/03/15 are here.

PLAYER GAMES MPG 11/10 11/22 12/3 PPA
John Wall 22 35.0 153 129 136 168
Marcin Gortat 19 29.6 91 112 128 133
Otto Porter 22 33.0 144 158 104 116
Ramon Sessions 22 19.0 131 119 84 90
Bradley Beal 17 36.5 128 108 96 87
Jared Dudley 21 26.5 36 92 90 85
Kris Humphries 17 17.6 90 121 95 80
Gary Neal 20 22.0 23 49 64 75
Nene Hilario 12 17.4 58 90 80 74
Ryan Hollins 5 9.6 -40 60
Drew Gooden 6 12.8 99 51 57 56
Garrett Temple 20 17.6 38 106 57 54
Kelly Oubre 15 6.9 -103 -4 -40 -44
DeJuan Blair 12 8.5 -345 -129 -112 -45

If I could have one Christmas present for the Wizards, it’d be a starting quality power forward.

Wizards Update: Porter Leading The Way

otto porter

I have to say I’m pretty torn on the Wizards so far. On one hand, they’re 6-4 despite injuries to Bradley Beal, Alan Anderson and Martell Webster, as well as growing pains as they figure out how their personnel can mesh with their new Pace & Space offense.

Sticking with the positives: Otto Porter is having a terrific season (leads the team in PPA — see below), and they’re getting some decent play Ramon Sessions, Nenê and Jared Dudley off the bench.

On the other hand…John Wall — despite his publicly stated desire to be an MVP candidate this season — is performing like a pretty average starter, the team seems to crumble whenever Kris Humphries is on the floor (despite decent production from Humphries), and Marcin Gortat is lost on offense.

Since I believe Wall and Gortat will perform more like they did last season, my biggest area of concern is at power forward. Humphries continues to be fairly productive, and has even added a three-point shot. So far this season, he’s at .412. An analysis I did in July suggested .365 could be anticipated.

The problem: the Wizards collapse when he’s out there. So far, Washington is 5.2 points per 100 possessions worse offensively and 5.9 points per 100 possessions worse defensively (net -11.1 points per 100 possessions) when Humphries is out there. While the results are a bit extreme because of the small sample size, keep in mind the Wizards were worse on both ends of the floor with Humphries last season, and Boston was worse on offense with him out there.

My theory: Humphries plays like my iPhone 4 trying to load an app. When it’s time for business (like catching a pass), there’s a pause, then a blank screen, then a spinning wheel, and then maybe some action. It could be that Humphries is just better against reserves than starters.

Unfortunately, the Wizards don’t really have a viable option to start at power forward. Nenê can’t be relied on in that role, and moving him into the starting lineup leaves the team without a reserve center. I’m dubious about Jared Dudley as a viable option — he’s been a below-average rebounder for a SMALL forward throughout his career. (It’s worth mentioning that in the tiny sample size recorded thus far, Dudley is rebounding at his best rate since his rookie year.)

If the team can’t figure out how to play with Humphries as a starter, they may be forced to start Dudley and take some lumps on the board.

Player Production Average

The ratings below are a metric I developed called Player Production Average (PPA). In PPA, players are credited for things they do that help a team win, and debited for things that don’t, each in proportion to what causes teams to win and lose. PPA is pace neutral, accounts for defense, and includes an adjustment based on the level of competition faced when a player is on the floor. In PPA, average is 100, higher is better, and replacement level is 45.

League-wide PPA scores through games played 11/22/15 are here.


PLAYER GAMES MPG 11/10 PPA
Otto Porter 10 32.9 144 158
John Wall 10 32.7 153 129
Kris Humphries 10 20.8 90 121
Ramon Sessions 10 18.0 131 119
Marcin Gortat 10 27.5 91 112
Bradley Beal 7 33.9 128 108
Garrett Temple 8 15.4 38 106
Jared Dudley 9 21.7 36 92
Nene Hilario 9 18.6 58 90
Drew Gooden 6 12.8 99 51
Gary Neal 10 18.7 23 49
Kelly Oubre 6 10.0 -103 -4
DeJuan Blair 4 8.5 -345 -129


Wizards Renovated Offense Needs Time

beal rips

The Washington Wizards have embarked on a major renovation of their offense, and while the results are decidedly mixed through their first six games, the right thing is to stay the course and see if players can grow into new roles.

Last season, the Wizards were 18th in pace and 28th in three-point attempt rate (the percentage of field goal attempts from three-point range). So far in 2015-16, they’re second in pace (a whopping 8.4 possessions per 48 minutes faster) and 12th in three-point attempt rate.

The positives so far: decent shooting and an uptick in trips to the free throw line. The negatives: the league’s worst turnover rate, a drop-off in rebounding effectiveness, and an elevated opponent shooting percentage.

While patience is warranted as the team figures out how to operate in the new system, the emphasis on playing at a fast pace continues to be a concern for me. Why? Because pace of play has nothing to do with what causes teams to win games. Go through the record of games and seasons, and you’ll find good (and bad) teams that played fast, slow and in-between. What makes sense is for a team to play at a pace where it’s comfortable, where the players are under control, and where it can get good shots and maximize efficiency. If that’s fast, then play fast. If it’s slower, then slow down.

At the risk of oversimplifying, basketball is a game where teams take turns with the ball until the clock runs out. The number of possessions are about the same for each team over the course of a game — sometimes there’s a possession or two variance based on end-of-period exchanges. Playing fast doesn’t get a team extra possessions because no matter how quick they shoot the ball, the other team gets it back. What matters is efficiency — generating more points on your possessions than the other guy does on his.

The emphasis on playing fast — at least as it’s been implemented by the Wizards so far — seems misguided to me. Pushing the ball up the floor every possession is a good strategy because it can stress the defense, catch defenders out of position, and give Washington more time to run its half court offense. But if rushing leads to more turnovers, and weakened defensive rebounding, the strategy is missing the point.

What really concerns me about the “play fast” mantra is the question of whether the Wizards truly have a grasp on what’s important for a team to win. There’s a palpable feeling that they’re mimicking Golden State without a true understanding of why that style of play works for the Warriors, and how it fits Washington’s personnel. What wins games in the NBA? Doing these things better than the opponent (in order of importance): shooting from the floor, controlling turnovers, getting to the free throw line, and rebounding. Pace ain’t on the list.

Player Production Average

The ratings below are a metric I developed called Player Production Average (PPA). In PPA, players are credited for things they do that help a team win, and debited for things that don’t, each in proportion to what causes teams to win and lose. PPA is pace neutral, accounts for defense, and includes an adjustment based on the level of competition faced when a player is on the floor. In PPA, average is 100, higher is better, and replacement level is 45.

PLAYER GAMES MPG PPA
John Wall 6 34.8 153
Otto Porter 6 34.0 144
Ramon Sessions 6 17.2 131
Bradley Beal 6 34.7 128
Drew Gooden 4 15.0 99
Marcin Gortat 6 28.0 91
Kris Humphries 6 20.5 90
Nene Hilario 6 18.0 58
Garrett Temple 4 3.5 38
Jared Dudley 5 21.6 36
Gary Neal 6 17.7 23
Kelly Oubre 3 5.3 -103
DeJuan Blair 2 6.0 -345

In many ways, I find these numbers (drawn from a small sample size) encouraging. The team’s most productive players so far are its youthful trio of high draft picks: John Wall, Otto Porter, and Bradley Beal.

It’s hard to believe veterans like Marcin Gortat and Jared Dudley will continue playing this poorly. Look for Nenê’s production to improve some as well.

On the other hand, don’t expect big jumps in productivity from DeJuan Blair (who apparently has forgotten how to play basketball), Gary Neal and Garrett Temple.

Also, much as I hate to write it, I think Porter’s PPA is ripe for a drop-off. It’s not likely he’ll continue to shoot 70% from two-point range or have a 60-plus percent efg.

Projection: Wizards to Win 42

wall 02My 2015-16 Wizards preview is up at Vice Sports. I won’t steal my own thunder much, except to say that my projection approach says the Wizards will win 41-42 games this season. Not as encouraging as I’d hoped, and I had some mild surprises in the numbers — younger players not being predicted to improve as much as I’d have intuitively expected.

At any rate, please click over and give it a read at Vice.

The 2015 NBA Draft According to YODA

yoda2A few years back, I embarked on an effort to develop a statistically-based, objective method of evaluating prospects for the NBA draft. I make no claims that it’s perfect, but I’ve found the results decent enough, albeit not yet subjected to rigorous analysis. That’s coming.

When I get time.

Someday.

On the Wizards message board at RealGM, I referred to the effort a few times as “Ye Olde Draft Analyzer,” someone called it YODA, and the name stuck. YODA isn’t complex — at least not yet. It’s built on the Player Production Average metric I devised that credits players for things they do to help their teams win, and debits them for things they do that hurt the cause — each in proper proportion. YODA takes each player’s production (box score stats) then applies adjustments for position, age, team strength/level of competition, and objective measures of physical attributes (combine measurements and times).

In general, YODA likes efficient players who shoot well, rebound well, assist without committing turnovers, and generate blocks and steals without fouling too much. Being on a good team that plays a challenging schedule is also helpful, but not determinant — players like Kenneth Faried, Paul Millsap and Danny Granger had excellent ratings despite not playing for traditional powers.

YODA’s biggest limitation is international players. I haven’t had the time to research the numbers posted by prospects overseas, or to objectively assess the quality of the competition they face. Rather than guessing, I’ve chosen to leave them out of the process for now. Given the global nature of the draft, that’s a significant limitation, and it’s one I hope to fix for next year.

My belief on draft strategy is that the smart move is to pick the best player available, even if he doesn’t fit an immediate need. My approach is to first rate players in absolute terms, then group them into tiers of “about the same.” The idea is that when several players of “about the same” quality are available when your team’s pick comes, the team can pick the player they think best fits current needs. But, don’t reach into a lower tier for a perceived need. Just pick the better player and make another move down the road, if necessary.

Here’s this year’s draft in order of both absolute value according to YODA, and divided by tier.

TIER ONE

  • Karl-Anthony Towns, PF, Kentucky
  • Jahlil Okafor, C, Duke

TIER TWO

  • D’Angelo Russell, PG, Ohio State
  • Frank Kaminsky, C, Wisconsin

TIER THREE

  • Rondae Hollis-Jefferson, SF, Arizona
  • Kelly Oubre, SF, Kansas (EDITED position due to corrected measurements)
  • Delon Wright, PG, Utah
  • Cameron Payne, PG, Murray State
  • Bobby Portis, PF, Arkansas

TIER FOUR

  • Justise Winslow, SF, Duke
  • Myles Turner, C, Texas

TIER FIVE

  • Jerian Grant, PG, Notre Dame
  • Robert Upshaw, C, Washington
  • Willie Cauley-Stein, C, Kentucky
  • Sam Dekker, SF, Wisconsin
  • Devin Booker, SG, Kentucky

TIER SIX

  • Kevon Looney, PF, UCLA
  • Tyus Jones, PG, Duke
  • Cliff Alexander, PF/C, Kansas
  • Terry Rozier, G, Louisville
  • Justin Anderson, SF, Virginia
  • Stanley Johnson, SF, Arizona

TIER SEVEN

  • Briante Weber, PG, VCU
  • Bryce Jones, SG, Iowa State
  • Aaron White, PF, Iowa
  • Trey Lyles, PF, Kentucky
  • Montrezl Harrell, PF, Louisville

TIER EIGHT

  • Richaun Holmes, PF, Bowling Green
  • Pat Connaughton, SG, Notre Dame
  • R.J. Hunter, SG, Georgia State

In simple terms, the first round grades end with Tier Six. If things go more or less the way the mock drafts predict, the Wizards may be able to select a PG from Tier Three (Delon Wright), or perhaps a PF with potential like Looney.

While I fully expect the Wizards to sell or give away their second round pick, I think there may be some opportunities to get potentially useful players on inexpensive contracts with additional second rounders. I’d be interested in taking a guy like Cliff Alexander, or even Robert Upshaw (assuming he’s medically cleared to play despite a heart condition).

The consensus view on this year’s draft seems to be that it’s top heavy with a steep drop-off in talent after the lottery. I don’t really see that in the numbers. Towns and Okafor are a relatively weak top two, and the drop in ratings isn’t any greater than it is in most years. In other words, it looks like a draft.

Feel free to tweet me if you have questions about specific players. I’ve analyzed most seniors, and virtually all of the early entrants (except for the international players).

EDITED on June 30 when I was able to confirm that Kelly Oubre’s standing reach, as measured at the scouting combine, was incorrect. When the measurement was corrected, Oubre moved from Tier Four to Tier Three.

NBA Playoffs: PPA Update

Just numbers because…no time. This is through games played on May 10, 2015.

Player Production Average (PPA) is an overall rating stat I developed that credits players for things they do that help a team win and debits them for things that hurt the cause. PPA is pace neutral, accounts for defense, and includes a “degree of difficulty” factor based on the level of competition a player faces while on the floor. In PPA, 100 = average, higher is better and replacement level is 45.

Player POS Tm G MPG PPA
DeMarre Carroll SF ATL 9 35.2 212
Al Horford C ATL 9 32.2 182
Paul Millsap PF ATL 9 35.7 174
Kyle Korver SG ATL 9 38.2 147
Jeff Teague PG ATL 9 32.1 108
Shelvin Mack PG ATL 7 4.9 96
Mike Scott PF ATL 8 11.1 83
Mike Muscala PF ATL 3 8.0 66
Dennis Schroder PG ATL 9 17.9 63
Pero Antic PF ATL 9 16.7 34
Kent Bazemore SG ATL 9 17.7 32
John Jenkins SG ATL 2 2.5 -85
Elton Brand PF ATL 2 2.0 -212
Jae Crowder SF BOS 4 25.0 126
Jared Sullinger PF BOS 4 20.0 110
Tyler Zeller C BOS 4 22.5 85
Isaiah Thomas PG BOS 4 29.8 67
Marcus Smart PG BOS 4 22.5 57
Evan Turner SG BOS 4 29.5 50
Brandon Bass PF BOS 4 21.5 49
Avery Bradley SG BOS 4 33.3 23
Kelly Olynyk C BOS 4 13.3 20
Jonas Jerebko PF BOS 4 17.0 -13
Gerald Wallace SF BOS 1 4.0 -68
Luigi Datome SF BOS 3 4.7 -87
Phil Pressey PG BOS 2 2.5 -158
Brook Lopez C BRK 6 39.0 166
Alan Anderson SG BRK 6 23.7 122
Joe Johnson SG BRK 6 41.5 103
Jarrett Jack PG BRK 6 25.5 94
Deron Williams PG BRK 6 32.0 87
Markel Brown SG BRK 2 5.0 68
Thaddeus Young PF BRK 6 31.7 55
Bojan Bogdanovic SF BRK 6 34.3 48
Mason Plumlee C BRK 6 8.2 30
Earl Clark PF BRK 2 6.5 -47
Darius Morris PG BRK 1 5.0 -84
Mirza Teletovic PF BRK 3 5.3 -115
Jerome Jordan C BRK 1 5.0 -168
Jimmy Butler SG CHI 10 42.2 195
Pau Gasol PF CHI 9 32.6 191
Nazr Mohammed C CHI 2 5.5 155
Mike Dunleavy SF CHI 10 32.1 137
Derrick Rose PG CHI 10 37.6 123
Joakim Noah C CHI 10 31.9 120
Doug McDermott SF CHI 2 3.5 119
Taj Gibson PF CHI 10 23.5 117
Kirk Hinrich SG CHI 8 10.4 89
Nikola Mirotic PF CHI 9 14.7 10
Tony Snell SF CHI 9 14.4 7
E’Twaun Moore SG CHI 2 3.0 -5
Aaron Brooks PG CHI 10 11.5 -14
Kevin Love PF CLE 4 26.8 165
Timofey Mozgov C CLE 8 25.5 152
Kyrie Irving PG CLE 8 40.0 143
Tristan Thompson PF CLE 8 30.6 141
LeBron James SF CLE 8 41.9 120
Iman Shumpert SG CLE 8 31.9 113
J.R. Smith SG CLE 6 26.7 107
Mike Miller SF CLE 2 14.5 84
Shawn Marion SF CLE 3 4.0 48
James Jones SF CLE 8 12.6 28
Matthew Dellavedova SG CLE 8 16.3 20
Kendrick Perkins C CLE 4 5.0 -4
Joe Harris SG CLE 1 2.0 -217
Al-Farouq Aminu SF DAL 5 30.0 177
Tyson Chandler C DAL 5 32.0 161
Charlie Villanueva PF DAL 5 8.6 135
Monta Ellis SG DAL 5 39.4 111
Dirk Nowitzki PF DAL 5 36.2 109
Jose Barea PG DAL 5 30.8 68
Raymond Felton PG DAL 3 12.0 18
Rajon Rondo PG DAL 2 18.5 15
Bernard James C DAL 1 2.0 0
Greg Smith PF DAL 1 1.0 0
Amar’e Stoudemire PF DAL 5 15.0 -3
Devin Harris PG DAL 4 18.5 -14
Richard Jefferson SF DAL 4 12.8 -30
Chandler Parsons SF DAL 1 37.0 -33
Dwight Powell PF DAL 2 1.5 -81
Stephen Curry PG GSW 7 39.6 179
Andrew Bogut C GSW 7 25.9 159
Harrison Barnes SF GSW 7 32.3 151
Draymond Green SF GSW 7 38.7 149
Klay Thompson SG GSW 7 37.1 130
Festus Ezeli C GSW 7 6.3 55
Andre Iguodala SG GSW 7 28.0 53
Shaun Livingston PG GSW 7 14.4 49
Leandro Barbosa SG GSW 7 12.6 35
Marreese Speights PF GSW 7 7.3 21
Justin Holiday SG GSW 1 1.0 0
David Lee PF GSW 2 4.5 -106
James Michael McAdoo PF GSW 1 1.0 -285
James Harden SG HOU 9 35.7 190
Dwight Howard C HOU 9 32.7 167
Jason Terry SG HOU 9 26.8 95
Clint Capela C HOU 9 7.8 82
Terrence Jones PF HOU 9 24.4 78
Trevor Ariza SF HOU 9 37.4 64
Josh Smith PF HOU 9 22.2 61
Pablo Prigioni PG HOU 9 20.7 34
Corey Brewer SF HOU 9 26.0 15
Nick Johnson SG HOU 5 5.6 -7
Joey Dorsey PF HOU 5 2.4 -36
Kostas Papanikolaou SF HOU 5 3.0 -199
Chris Paul PG LAC 9 36.0 230
DeAndre Jordan C LAC 11 34.3 193
Blake Griffin PF LAC 11 39.4 193
Spencer Hawes PF LAC 5 6.2 102
Austin Rivers PG LAC 11 18.3 90
Matt Barnes SF LAC 11 30.3 90
Dahntay Jones SF LAC 9 1.7 87
J.J. Redick SG LAC 11 38.7 81
Jamal Crawford SG LAC 11 27.5 41
Lester Hudson SG LAC 5 6.8 31
Glen Davis PF LAC 11 11.5 1
Hedo Turkoglu SF LAC 10 5.1 -23
Ekpe Udoh PF LAC 4 3.0 -57
Jordan Adams SG MEM 2 1.0 853
Russ Smith PG MEM 1 1.0 284
Mike Conley PG MEM 5 27.8 192
Marc Gasol C MEM 8 37.1 172
Courtney Lee SG MEM 8 33.5 161
Tony Allen SG MEM 8 32.1 151
Kosta Koufos C MEM 8 11.8 141
Beno Udrih PG MEM 7 19.6 92
Vince Carter SG MEM 8 15.8 73
JaMychal Green PF MEM 2 1.0 69
Zach Randolph PF MEM 8 35.5 66
Nick Calathes SG MEM 6 17.3 18
Jeff Green SF MEM 8 25.6 7
Jon Leuer PF MEM 2 2.0 -37
Zaza Pachulia C MIL 6 21.5 140
Jared Dudley SG MIL 6 18.3 122
John Henson C MIL 6 25.5 118
Khris Middleton PF MIL 6 38.7 88
Jerryd Bayless PG MIL 6 20.0 53
Tyler Ennis PG MIL 1 16.0 47
Giannis Antetokounmpo SG MIL 6 33.5 47
Michael Carter-Williams PG MIL 6 31.8 43
O.J. Mayo SG MIL 6 26.0 41
Jorge Gutierrez PG MIL 1 12.0 24
Ersan Ilyasova PF MIL 6 23.7 21
Johnny O’Bryant PF MIL 1 12.0 -3
Miles Plumlee C MIL 1 16.0 -66
Alexis Ajinca C NOP 3 3.3 244
Anthony Davis PF NOP 4 43.0 198
Dante Cunningham PF NOP 4 18.8 143
Quincy Pondexter SF NOP 4 31.0 95
Omer Asik C NOP 4 19.8 91
Eric Gordon SG NOP 4 35.8 85
Ryan Anderson PF NOP 4 23.8 81
Jrue Holiday PG NOP 3 18.3 58
Tyreke Evans SF NOP 4 31.3 49
Norris Cole PG NOP 4 26.5 -39
Allen Crabbe SG POR 2 19.5 150
Meyers Leonard C POR 5 21.2 144
Alonzo Gee SF POR 1 3.0 133
Joel Freeland C POR 2 3.5 96
C.J. McCollum SG POR 5 33.2 93
Robin Lopez C POR 5 23.4 89
LaMarcus Aldridge PF POR 5 41.6 79
Nicolas Batum SF POR 5 41.8 66
Chris Kaman C POR 3 12.3 56
Damian Lillard PG POR 5 40.2 54
Steve Blake PG POR 5 8.6 -26
Arron Afflalo SG POR 3 20.0 -130
Tim Frazier PG POR 2 1.5 -312
Tim Duncan PF SAS 7 35.7 213
Kawhi Leonard SF SAS 7 35.7 154
Patrick Mills PG SAS 7 16.0 154
Marco Belinelli SG SAS 7 16.6 136
Boris Diaw PF SAS 7 28.3 96
Danny Green SG SAS 7 29.1 86
Manu Ginobili SG SAS 7 18.7 80
Cory Joseph PG SAS 4 5.5 77
Jeff Ayres PF SAS 3 4.0 43
Tiago Splitter C SAS 7 17.6 23
Tony Parker PG SAS 7 30.0 -18
Aron Baynes C SAS 4 10.0 -52
Matt Bonner PF SAS 7 5.1 -70
Greg Stiemsma C TOR 1 2.0 530
Jonas Valanciunas C TOR 4 26.5 141
Patrick Patterson PF TOR 4 26.5 121
Amir Johnson PF TOR 4 28.0 90
DeMar DeRozan SG TOR 4 39.8 74
Terrence Ross SF TOR 4 26.8 38
Lou Williams SG TOR 4 25.5 26
Greivis Vasquez PG TOR 4 25.3 14
Kyle Lowry PG TOR 4 32.8 -6
Tyler Hansbrough PF TOR 4 12.0 -13
James Johnson PF TOR 2 6.0 -117
Marcin Gortat C WAS 7 32.6 227
John Wall PG WAS 5 38.2 175
Paul Pierce SF WAS 7 29.4 160
Otto Porter SF WAS 7 33.3 153
Kris Humphries PF WAS 1 5.0 140
Bradley Beal SG WAS 7 41.3 109
Drew Gooden PF WAS 7 18.3 101
Ramon Sessions PG WAS 7 22.6 62
Nene Hilario PF WAS 7 24.6 54
Will Bynum SG WAS 2 8.5 35
Martell Webster SF WAS 1 4.0 34
Kevin Seraphin C WAS 5 8.8 -19
Garrett Temple SG WAS 2 11.0 -46
Rasual Butler SF WAS 2 3.5 -82

The Inside Story of How the Wizards Beat the Raptors

Gortat warrior

The Washington Wizards vanquished the Toronto Raptors in the first round of the NBA playoffs thanks to an innovative approach conceived by team president Ernie Grunfeld, funded by owner Ted Leonsis, and implemented by head coach Randy Wittman. Drawing upon unique abilities possessed by point guard John Wall, Wittman and Grunfeld developed a plan that in the days before the playoffs sent Wall and center Marcin Gortat on a (until now) top secret mission to prehistoric times.

“It was just a little time travel,” Wall said, stifling a yawn. “Just doing whatever I can to help my teammates out.”

” ‘Time travel?’ He said that?” Wittman snapped when told of Wall’s comment. “Okay, first of all, it’s not time travel. It’s just a way of using John’s ability to alter the space-time continuum to bridge the interdimensional gap between this reality and another in which conditions very much like our prehistoric era continue to exist.”

According to sources, Wall was essential to executing the project, but Gortat volunteered.

“We were going to play Raptor,” the Polish center said. “This way I could study real raptor, see how it move, see how it fight, see how it love. I fight six velociraptor at same time — hand-to-hand. After that, Toronto Raptor not so tough.”

While Gortat engaged in mortal battle with ferocious dinosaurs from the later Cretaceous Period, Wall did no fighting and did not engage with the ferocious reptiles.

“I’m competitive, but I’m not a fighter,” Wall said. “i just mostly slept.”

While Wall’s account of an extended nap — made necessary, he said, by the rigors of time travel — had its charm, it did not stand up to investigation. In reality, Wall executed the second part of the Grunfeldian Plan, and tracked down a pubescent Paul Pierce.

“Paul’s one of the oldest players in the league, and we were concerned about his physical condition,” said Wizards vice president Tommy Sheppard, speaking on condition of anonymity. “By sending John and March back seventy-one million years, we felt we could get March first-hand experience with some velociraptors and we could do something to help Paul get back to top form. This was definitely a two birds, one stone kind of thing.”

Wall’s mission was to locate the young Pierce and persuade him to provide biological samples, including blood, spinal fluid and stem cells. The samples would then be combined in Wittman’s laboratory, located deep beneath the Verizon Center, into a genetic cocktail that would rejuvenate the aging Pierce.

“Gotta say it didn’t take much convincing,” Wall said when he learned that details of his trip were known. “Once I told him about his later self being on a team in the playoffs, his competitive nature kicked in and he wanted to help. ‘Course I first had to beat him in a game of Micropachycephalosaurus before he’d do it, but basketball hadn’t even been invented back then so I had a little bit of an advantage. It was tough, but…well…you saw what happened in round one. Look man, Pierce ain’t changed a bit.”

Successful execution of the Grunfeldian Plan had several positive effects fans could see. Gortat and Pierce performed spectacularly in round one. And, freed from the rigors of researching and theorizing about interdimensional temporal travel, Wittman was able to refocus his attention on coaching the team.

“I looked at the numbers and said to the guys ‘What the hell is this?’ ” Wittman said. “Why are we taking so many two-point jumpers? What’s wrong with you people? Do I have to think of everything? Attack the hoop and shoot threes.”

The plan nearly backfired, however, when Wall, exhausted from interdimensional travel, searching for the younger version of Pierce, and the epic game of Micropachycephalosaurus, played horribly in game one. Sources with knowledge of the situation said Wall recovered thanks to some remaining bottles of Caron Butler’s “Tuff Juice.”

While details remain scarce, preparation for the team’s second round matchup with the Atlanta Hawks involved a journey to Middle Earth where Gortat taught teammates the art of riding the Great Eagles of Manwë. Sources could not corroborate the story with cell phone photos or video by publication time. I was able to obtain this image of a young Marcin Gortat riding one of the Great Eagles in Middle Earth, which Gortat claims is located not far from where he was born in Lodz, Poland.

A young Marcin Gortat riding a Great Eagle of Manwë.

Player Production Average: First Round

Player Production Average (PPA) is an overall rating stat I developed that credits players for things they do that help a team win and debits them for things that hurt the cause. PPA is pace neutral, accounts for defense, and includes a “degree of difficulty” factor based on the level of competition a player faces while on the floor. In PPA, 100 = average, higher is better and replacement level is 45.

WASHINGTON WIZARDS
POS GMS MPG PPA
Marcin Gortat C 4 31.3 294
Paul Pierce SF 4 28.5 209
Will Bynum SG 1 4.0 183
John Wall PG 4 38.0 165
Otto Porter SF 4 32.0 147
Kris Humphries PF 1 5.0 146
Bradley Beal SG 4 41.8 116
Drew Gooden PF 4 20.5 107
Nene Hilario PF 4 24.3 82
Ramon Sessions PG 4 16.5 67
Kevin Seraphin C 3 11.0 50
Martell Webster SF 1 4.0 36
Rasual Butler SF 2 3.5 -85
TORONTO RAPTORS POS GMS MPG PPA
Greg Stiemsma C 1 2.0 535
Jonas Valanciunas C 4 26.5 142
Patrick Patterson PF 4 26.5 122
Amir Johnson PF 4 28.0 91
DeMar DeRozan SG 4 39.8 75
Terrence Ross SF 4 26.8 38
Lou Williams SG 4 25.5 26
Greivis Vasquez PG 4 25.3 14
Kyle Lowry PG 4 32.8 -6
Tyler Hansbrough PF 4 12.0 -13
James Johnson PF 2 6.0 -118

While the playoffs are the most important part of the NBA season, fans and analysts tend to go overboard in using postseason results to reach new conclusions. The Wizards were impressive in round one, but it’s worth keeping in mind that any given round of the post-season (especially a four-game sweep) is the very definition of Small Sample Size Theater. Bradley Beal led the Wizards with 167 minutes in the first round.

I’d caution against overreaching in using the win over Toronto to make a significant reassessment of the Wizards. They’ll get a tougher test against the Hawks.

That said, the good news from round one was getting good production from the team’s youthful triumvirate. Washington was led by Gortat and Pierce, both of whom were outlandishly efficient, and got outstanding play from Wall and Otto Porter, and solid production from Bradley Beal.

Unsurprisingly (considering Washington’s resounding series win), five Wizards were more productive than the most productive Toronto player. The Raptors were hampered by an extreme lack of production from its backcourt, including a net negative performance from All-Star Kyle Lowry.

Meanwhile, Gortat was the league’s most productive player in the first round, and Pierce’s production ranked eighth.