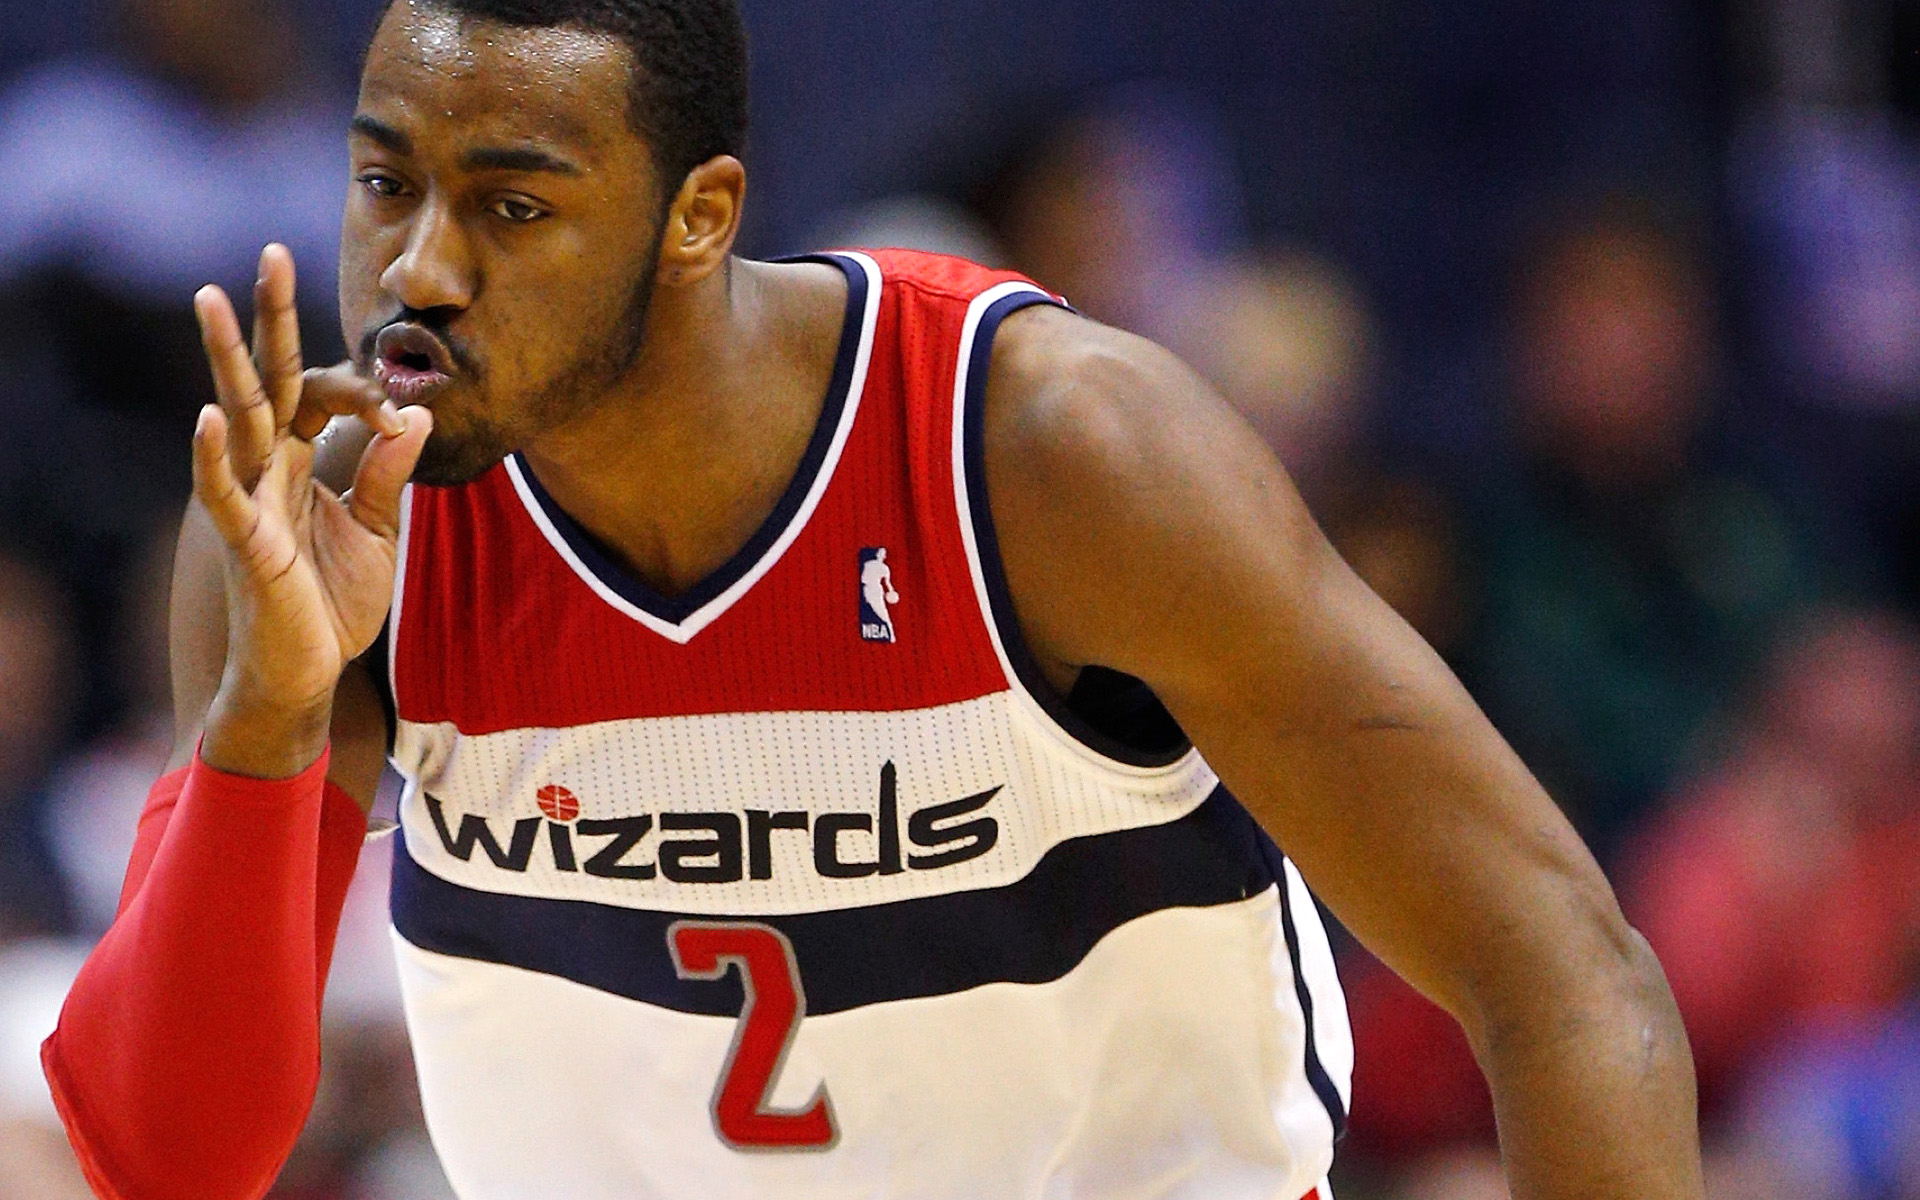
Now in his fifth year, Wizards PG John Wall is having the best season of his career. He’s drawn accolades from observers around the league, and some Washington fans have even started wondering if he might be a fringe MVP candidate. The MVP talk and the “he’s the best PG in the league” assertions are premature, however. He’s terrifically productive, but there’s still room for significant improvement.
Put away the pitchforks and torches. While Wall isn’t quite where fans want to place him, this is really good news for the Wizards. He’s a phenomenal player whose best days are likely still in the future.
While Wall’s passing and offensive creativity elicits praise, his greatest contribution is on the defensive end. In the defense part of my metric (Player Production Average — PPA for short), Wall rates as the league’s best defensive PG. That’s not a typo. Number one. Top of the heap. Nobody better. That finding is echoed by ESPN’s Real Plus Minus stat. If the season ended today, he’d be on my first-team All-Defense ballot.
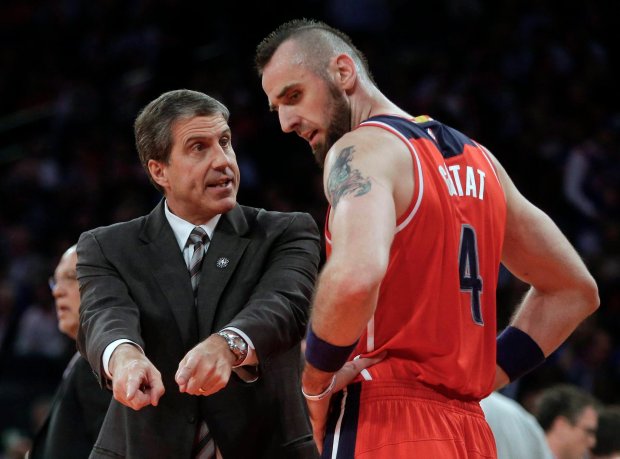
As head coach Randy Wittman told the Sports Junkies this morning, Wall has all the attributes of an outstanding defender — size, quickness, speed, strength, length. And while he’s rated as a good defender in my system in previous years, he’s made the defensive leap this season with suffocating on-ball pressure, hard close-outs on shooters, and impeccable timing in the passing lanes.
The Los Angeles Clippers, led by elite PG Chris Paul, struggled to get into their offensive sets early in Washington’s win last week because of Wall’s pressure. Consider this: Paul has 49 total turnovers this season. Six of them came against the Wizards.
By now you’re probably wondering: If Wall’s so great on defense and he’s such a great passer and the Wizards are winning, why don’t you agree he’s an MVP candidate? Why are you about to tell me he’s not a top five PG?
Which brings me back to a junk metric I created last season: Only Good Stuff. In its simplest form, OGS is points + rebounds + assists + steals + blocks.
Wall is among the game’s more active players when he’s out there. He produces lots of OGS — 7th most in the league, in fact. Here’s the top 10 in OGS:
James Harden — 977
Anthony Davis — 940
Stephen Curry — 922
Kobe Bryant — 917
Lebron James — 917
LaMarcus Aldridge — 869
John Wall — 867
Blake Griffin — 843
Kyle Lowry — 361
Damian Lillard — 835
That’s a pretty impressive group, and Wall sits second among PGs. But, it’s ONLY the good stuff. What if we look at the other side of the ledger — Only Bad Stuff (missed field goal attempts + 0.5 x missed free throw attempts + turnovers + fouls)? Well, Wall’s near the top of that list too — 6th most OBS. The bottom 10:
Kobe Bryant — 502
James Harden — 422
Monta Ellis — 389
Josh Smith — 387
Carmelo Anthony — 384
John Wall — 367
Tyreke Evans — 365
Kyle Lowry — 361
Blake Griffin — 360
Stephen Curry — 351
So, with Wall (and several other of the game’s outstanding players), lots of good AND lots of “bad.” What if we combine the two? Because the categories aren’t weighted based on how much they contribute to winning, let’s call this last category Unweighted Total Stuff (UTS) — OGS – OBS. Here’s the top 10:
Anthony Davis — 687
Stephen Curry — 571
Lebron James — 559
James Harden — 555
Chris Paul — 523
LaMarcus Aldridge — 523
Marc Gasol — 512
Tyson Chandler — 505
John Wall & Damian Lillard — 501
Blake Griffin — 484
Enough with the “stuff,” according to PPA (which is pace neutral, accounts for defense, and includes a degree of difficulty factor), Wall currently sits 8th among PGs on a per minute basis. Westbrook, Curry and Paul are clearly the top three. Lillard is next. Then it’s a tight group of Jeff Teague, Lowry, Mike Conley and Wall.
The scores of Wall’s group are close enough that I’d classify them as “about the same” and reasonable minds can differ on what order they should be in. I won’t argue if you want to push Wall to fifth, though I don’t see justification for ranking him higher at this point.
As mentioned above, Wall rates as the best defender — Lowry and Conley rate as average; Teague as a good-not-outstanding defender. However, Wall is the least efficient on offense among the top PGs by approximately 8 points per 100 possessions.
In TOTAL production, Wall currently sits 5th behind Curry, Paul, Lillard and Lowry. Kyrie Irving slips in ahead of Wall for fifth in per game PPA.
What can Wall do to improve? Shoot better and commit fewer turnovers.
How good has Wall been in December? His PPA for the month is 219 so far. If that was his PPA for the season, he’d rank 4th among PGs, ahead of Lillard, but still behind Westbrook, Curry and Paul.
To this week’s PPA update…
PPA is an overall rating stat I developed that credits players for things they do that help a team win and debits them for things that hurt the cause. PPA is pace neutral, accounts for defense, and includes a “degree of difficulty” factor based on the level of competition a player faces while on the floor. In PPA, 100 = average, higher is better and replacement level is 45.
PLAYER
GMS
MPG
10-Nov
18-Nov
24-Nov
3-Dec
8-Dec
PPA
Marcin Gortat
19
30.2
181
186
170
175
179
178
John Wall
19
35.9
185
180
180
168
167
175
Paul Pierce
19
27.3
140
138
165
134
134
154
Rasual Butler
15
21.6
60
131
116
128
155
140
Andre Miller
19
12.4
72
69
92
103
102
101
Kris Humphries
18
22.0
46
87
90
82
109
100
Nene Hilario
13
33.2
108
102
68
67
83
94
Bradley Beal
10
24.6
122
63
69
94
Garrett Temple
17
17.0
121
112
96
100
98
91
Otto Porter
18
20.1
97
106
101
95
84
81
Drew Gooden
12
15.9
42
40
59
78
64
47
Kevin Seraphin
18
15.3
38
13
17
12
28
34
DeJuan Blair
6
4.6
-41
-40
-40
-74
-56
-47
Glen Rice
5
8.6
-120
-117
-117
-117
-114
-113
The Paul Pierce signing looks better and better. The last time Pierce was this productive was the 2011-12 season. His efficiency numbers have surged as the SF has found the Fountain of Youth. One potential warning sign is a slip in his defensive impact since the season’s opening weeks. After rating solidly above average earlier in the year, he’s down to average in my most recent update.
Andre Miller is another of the Wizards ancients who continues to perform well. The team plays dramatically different when he replaces Wall in the lineup (they slow by 10 possessions per 48 minutes), but they’re crazy efficient when he’s out there. It seems like every game is a masterclass for how to get to the rim despite running in slow motion.
Statistical tidbit: so far this season, Wall is averaging 14.8 assists per 100 possessions. Miller is averaging 14.4.
Beal and Nenê increased production after a couple rough weeks. I hope Wittman continues to use Nenê off the bench where he can face opponent reserves when Washington is on offense, and anchor a weak defensive second unit.
Kevin Seraphin was up for a second straight week. His rebounding has improved the past couple weeks, though his offensive efficiency remains poor. Among the team’s regulars, he’s in a virtual tie with Miller as the least effective defender.
Over the past week, the Wizards rolled to convincing wins over the hapless Lakers and the not-awful Nuggets, and then lost a shoulda-won game against a middling Celtics squad. And, in the grand tradition of players having good games shortly after I rip them, Kevin Seraphin had probably his best game of the year against Denver.
Meanwhile, John Wall climbed into a tie with Rajon Rondo for having the biggest defensive impact for a point guard in my rating system. Wall shows up in my numbers as having the biggest defensive impact on the Wizards so far this season. Not bad for a guy who I still think has room for improvement on the defensive end.
Other positive defenders: Marcin Gortat, Nenê, Kris Humphries, and Garrett Temple.
The “about average” grouping includes: Otto Porter, Rasual Butler and Paul Pierce. Pierce, had gotten off to an excellent start defensively, but his individual performance seems to have slipped a bit over the past couple weeks.
Bradley Beal and Drew Gooden are in the “bad defensive impact” category so far. Kevin Seraphin and Andre Miller are defensive dumpster fires to this point in the year.
Below is the Player Production Average (PPA) update. PPA is an overall rating stat I developed that credits players for things they do that help a team win and debits them for things that hurt the cause. PPA is per-minute, pace neutral, accounts for defense, and includes a “degree of difficulty” factor based on the level of competition a player faces while on the floor. In PPA, 100 = average, higher is better and replacement level is 45.
PLAYER
GMS
MPG
10-Nov
18-Nov
24-Nov
3-Dec
PPA
Marcin Gortat
19
30.5
181
186
170
175
179
John Wall
19
35.3
185
180
180
168
167
Rasual Butler
15
20.3
60
131
116
128
155
Paul Pierce
19
26.6
140
138
165
134
134
Kris Humphries
18
19.7
46
87
90
82
109
Andre Miller
19
12.6
72
69
92
103
102
Garrett Temple
17
20.2
121
112
96
100
98
Otto Porter
18
21.9
97
106
101
95
84
Nene Hilario
13
25.5
108
102
68
67
83
Bradley Beal
10
30.4
122
63
69
Drew Gooden
12
17.3
42
40
59
78
64
Kevin Seraphin
18
15.2
38
13
17
12
28
DeJuan Blair
6
5.7
-41
-40
-40
-74
-56
Glen Rice
5
8.6
-120
-117
-117
-117
-114
The first thing I wondered about when perusing the table above was the lack of change in Wall’s PPA. My feeling was that he had a terrific week. But, the game log shows that he shoot poorly (efg of just .395) and that he committed 14 turnovers.
Rasual Butler had another week of outlandishly good shooting. In non-shooting categories, Butler’s numbers are all within established career norms. So far in Washington, he’s shooting .579 from 2pt range (vs. a career average of .435), and .545 from 3pt range (vs. a career average of .364).
I know fans want to attribute this to The Wall Effect, but a) only about half Butler’s minutes have been with Wall; b) he’s shooting with outlandish accuracy (and more often) when Wall’s on the bench; and c) his shooting numbers in Indiana last season were also significantly better than his previous career norms.
Butler
efg
usg
with Wall
.765
13.8%
w/o Wall
.700
20.3%
It may simply be that Butler worked hard and improved his shooting late in his career. And, it may be that he’s ripe for a regression. Sample sizes are still small: just 304 minutes and 112 shot attempts so far this season.
I’d like to see the Wizards continue to start Humprhies and bring Nenê off the bench. The starting lineup doesn’t appear to have suffered with the change, which isn’t surprising considering how little Nenê was producing. I suspect Nenê’s production will improve going against bench bigs. And, bringing him off the bench, gives the coaching staff options at PF and C, which means they can drop Seraphin from the rotation.
Despite the loss to Boston, the week was a positive one for the Wizards. Good teams win games convincingly. They don’t necessarily have the best record in close games, because they often avoid close games in the first place. That Washington won three in a row (including the win against Miami) by double digits may be a marker of the team getting stronger.
It’s good to be a Wizards fan right now. The team is 9-3, and reasonable forecasts suggest they’re probably the second best team in their conference. That the conference is historically weak isn’t their fault. The front office put together a solid, veteran squad, and the rest of the conference backed up.
So far this season, the NBA’s collective record vs. Eastern Conference teams is 111-85. That’s a .566 winning percentage, which works out to about 46 wins over an 82-game schedule.
Against the Western Conference, the NBA’s collective record is 86-112, which is a .434 winning percentage. That means about 36 wins over an 82-game schedule.
In other words, we would expect an average team facing the East to win about 46 games…which is what Basketball-Reference forecasts for the Wizards. To highlight the relative power differential between conferences, Basketball Reference predicts the Wizards will finish the season as the second best team in the East, but with an SRS (a robust and “simple” rating system that combines a team’s scoring differential with that of its opponents) that would land it 11th in the West.
But, this is a “moment in time” snapshot. The picture changes a bit with every game played. And there are still a ton of games on the schedule.
Before I get to this week’s stat update, I wanted to address a recurring sentiment I’ve been hearing from an array of Wizards fans. Basically, it’s some variation on the theme that Kevin Seraphin is having a good season or a breakout game or a coming out party or developing into a valuable reserve.
He’s not. At least not so far.
In fact, he’s playing poorly, even compared to his previous performances, which ranked him as the league’s least productive center (per minute) two seasons ago, and the second least productive center last season.
On offense, he’s shooting a good percentage this season, but continues to be a poor passer and a turnover machine. He rates as having very little defensive impact,because of his anemic defensive rebounding and rampant fouling.
The measuring stick on Seraphin is so off that one fan (who later suggested it was the beer talking) tweeted a rave about Seraphin being a revelation on a night the big fella shot 2-7 from the floor.
Here’s Seraphin’s game-by-game PPA scores for this season:
GMS
MIN
PPA
1
7.7
-202
2
1.9
-1003
3
22.1
184
4
13.9
-84
5
18.1
64
6
19.5
139
7
16.7
-70
8
16.1
-36
9
10.6
-36
10
23.4
83
11
13.1
-29
In PPA, 100 = average and higher is better. In 11 games, Seraphin has managed an above-average production rate twice. He’s been a net negative seven times — six, if you prefer to throw out the two-minute stint in the second game of the season.
I like Seraphin, the person. But, he’s not a good NBA player. He hasn’t become one. He’s showing very few signs of developing into one. The Wizards need to find another option as their backup center.
Below is the Player Production Average (PPA) update. PPA is an overall rating stat I developed that credits players for things they do that help a team win and debits them for things that hurt the cause. PPA is per-minute, pace neutral, accounts for defense, and includes a “degree of difficulty” factor based on the level of competition a player faces while on the floor. In PPA, 100 = average, higher is better and replacement level is 45.
PLAYER
GMS
MPG
10-Nov
18-Nov
PPA
John Wall
12
35.7
185
180
180
Marcin Gortat
12
30.9
181
186
170
Paul Pierce
12
27.5
140
138
165
Bradley Beal
3
30.7
122
Rasual Butler
8
16.4
60
131
116
Otto Porter
11
24.4
97
106
101
Garrett Temple
12
26.8
121
112
96
Andre Miller
12
12.6
72
69
92
Kris Humphries
11
15.6
46
87
90
Nene Hilario
11
27.1
108
102
68
Drew Gooden
7
18.0
42
40
59
Kevin Seraphin
11
14.8
38
13
17
DeJuan Blair
3
3.7
-41
-40
-40
Glen Rice
5
8.6
-120
-117
-117
This week, I’ve added a column to show each of the previous PPA updates. I’ll keep doing that as long as there’s space.
Wall seems to be settling in at a very high performance level. It’s scary to think there’s still lots of room for improvement too. Seth Partnow at BBall Breakdown did a nice job of summarizing the problem with Wall’s shot selection. Improved decision-making would likely improve the PG’s individual efficiency, and give his team a much-needed boost.
I don’t see how the Wizards could have hoped for more from Pierce, who is performing at a high level in the early going this season.
Nenê suffered a plantar fascia injury to his right foot in the win over Milwaukee. While it’s not good to lose a starter, Nenê has been playing nothing like a starter. His defense shows up as a slight net positive, but doesn’t come close to offsetting his awful offensive efficiency.
The Wizards are 7-2 to start the season, which ought to be cause for celebration. And, judging by media reports and fan reaction, that’s mostly what’s happening. So what’s wrong with me?
I’m unconvinced that the good record is particularly meaningful. This is not to suggest the Wizards need to apologize for the competition they’ve faced. They don’t make the schedule, and it’s not their fault that the East is possibly weaker than it was last season — when it was aggressively bad. All Washington can do is keep beating whoever’s on the calendar, which is what they’ve been doing so far.
But…I’m still concerned because of the way they’ve been winning. In sports, the best teams typically have the highest scoring differentials. The Wizards this season stand 11th in scoring differential at +2.22, which doesn’t sound bad except that their opponents have a collective scoring differential of -2.52. In other words, the Wizards are winning by less than the rest of the league against their opponents. At least so far.
There’s a strong sentiment that’s something like: Hey, the Wizards are winning games they should win, which is real progress for this franchise. To an extent, I agree. But, what often happens to an average team (and the numbers are suggesting the Wizards are pretty average) is that over time, they’ll lose games they “shouldn’t.” And there are a TON of games left on the schedule.
Some have pointed out that Washington has played so far without Bradley Beal, which is true but perhaps not as meaningful as some think. Beal was pretty average last season, and didn’t project to make a huge leap this year (at least not in my preseason analysis). Much of what I anticipated he’d provide has been produced by Garrett Temple and Rasual Butler thus far.
Perhaps the best reason to think Washington might be able to win 48-50 games this season is the good fortune of playing in a historically weak conference. Just six Eastern Conference teams have a positive scoring differential so far, and the sixth (Brooklyn) is us by one point total so far this season. All that said, in Basketball-Reference’s simple rating system (which combines scoring margin with strength of schedule), the Wizards currently sit 16th overall and 6th in the East. If they want to make some noise this season, they need to play better.
Below is the Player Production Average (PPA) update. PPA is an overall rating stat I developed that credits players for things they do that help a team win and debits them for things that hurt the cause. PPA is pace neutral, accounts for defense, and includes a “degree of difficulty” factor based on the level of competition a player faces while on the floor. In PPA, 100 = average, higher is better and replacement level is 45.
PLAYER
GMS
MPG
LW
PPA
Marcin Gortat
9
31.3
181
186
John Wall
9
35.6
185
180
Paul Pierce
9
27.4
140
138
Rasual Butler
5
19.2
60
131
Garrett Temple
9
31.1
121
112
Otto Porter
9
24.2
97
106
Nene Hilario
8
28.6
108
102
Kris Humphries
8
13.9
46
87
Andre Miller
9
12.9
72
69
Drew Gooden
6
19.5
42
40
Kevin Seraphin
8
14.5
38
13
DeJuan Blair
3
3.7
-41
-40
Glen Rice
5
8.6
-120
-118
The numbers show Gortat and Wall playing outstanding basketball. Both are performing at an All-Star level. Wall could push his way into All-NBA consideration, if he continues. Gortat’s PPA is currently sixth among centers behind Tyson Chandler, Omer Asik, DeAndre Jordan, DeMarcus Cousins and Robin Lopez.
Biggest improvers this week were Butler and Humprhies. Largest drop was from Seraphin, whose field goal percentage dropped while his rebounding, turnovers and fouling remained poor.
The Washington Wizards are off to a 5-2 start, tied with Miami for first place in the NBA’s Southeast Division, and sitting on pretty good odds of getting to 7-2 before they face Dallas at Verizon Center. And yet…in classic Wizards’ follower fashion, I’m actually a little worried.
Yep, it’s good they’re winning. But, they should be winning given the quality of the opponents they’ve faced so far. No, this isn’t one of those “they would be X record if they’d faced teams A, B and C” critiques. I don’t believe a team (or its fans) should ever have to apologize for the schedule, which is something they don’t control.
What has me a little worried is how pedestrian the Wizards have looked so far this season. They’ve outscored their opponents by 1.57 points per game so far this season; the league has outscored their opponents by 1.99 points per game.
I’d be more willing to buy the injury excuse if they weren’t getting career-best play from Garrett Temple standing in for Bradley Beal and Martell Webster.
But, this is this “little worry” because we’re still in the annual performance of Small Sample Size Theater. A study by Kevin Pelton, then-writing for Basketball Prospectus, showed that team-level stats tend to stabilize around the 25th of the season. Other research has shown that per minute stats for individual players begin to have validity as quick as 150 minutes. More is better, though.
Still, the early indications are that, despite the good record early on, the Wizards are an average team again this season. They’ve been good defensively, but a bit below average on offense. The hope is that getting Beal and Webster will help bolster the team offensively when they can return from injury.
Here’s the first Player Production Average (PPA) update of 2014-15. PPA is an overall rating stat I developed that credits players for things they do that help a team win and debits them for things that hurt the cause. PPA is pace neutral, accounts for defense, and includes a “degree of difficulty” factor based on the level of competition a player faces while on the floor. In PPA, 100 = average, higher is better and replacement level is 45.
PLAYER
GMS
MPG
PPA
John Wall
7
35.7
185
Marcin Gortat
7
32.7
181
Paul Pierce
7
28.0
140
Garrett Temple
7
33.7
121
Nene Hilario
6
29.2
108
Otto Porter
7
24.7
97
Andre Miller
7
12.9
72
Rasual Butler
3
14.3
60
Kris Humphries
6
9.8
46
Drew Gooden
6
19.5
42
Kevin Seraphin
6
13.8
38
DeJuan Blair
3
3.7
-41
Glen Rice
5
8.6
-120
Wall and Gortat should jump out immediately (they are at the top of the chart). Both guys have produced at an All-NBA level in the first seven games. This could be The Leap from Wall that fans have been waiting for. If he keeps it up. Gortat has actually performed at a 180ish PPA for a full season (2011-12).
Pierce has been everything Washington could have hoped he’d be. Over the summer, I went hunting through the stats to find players who’d be most likely to replace what Trevor Ariza had provided. The top name on the list: Paul Pierce. His offense could be more efficient, but he’s producing at about the level Ariza did last season — and his defense has been outstanding.
Nenê appears to have picked up more or less where he did last season, and that’s not such a great thing for the Wizards. He’s still a good defender, but his offensive efficiency seems to be departed.
It’s good to see Porter hovering around average. He’s been an asset off the bench, and seems to be figuring out the NBA game. Porter hasn’t been helped much by his oldster bench mates Miller and Gooden, who have been awful defensively since arriving in Washington.
And check out Porter look-alike Garrett Temple, who has so far played at the level of an almost-average NBA starter. Major kudos to Temple for all the work he’s done on his jumper. It shows in his form — especially in the way he sets his feet for takeoff, freezes the follow-through, and plants the landing.
I know folks are going to wonder about Kevin Seraphin, who rates below replacement level yet again. Seraphin is shooting 63% from the floor, and has had a couple nice games. His offensive efficiency is above average. And yet…he continues to be plagued by the same problems he’s had since his rookie year. Specifically, his rebounding is sub-par, he’s turnover prone, and he fouls too much.
Also worth noting are Kris Humprhies and DeJuan Blair, who were acquired in the offseason to provide frontcourt depth. So far, they’ve been behind Seraphin on the depth chart, which is astonishing. Humphries at least has some excuse — he missed three weeks of preseason with a hand injury. Blair has apparently been healthy, but can’t get on the floor despite dreadful play from Seraphin.
At some point, I gotta believe they’ll end the Seraphin experiment and give playing time to Humphries and/or Blair. Based on what they’ve done on the court so far this season, it’s fair to say that neither has made a case for playing ahead of Seraphin. At least not yet.
Improvement from the Washington Wizards youngsters, and an infusion of frontcourt depth will be offset by missed time due to injuries and declines from the team’s older players to keep the team in the middle of the NBA pack for another year. However, the team could be a dangerous playoffs matchup if they’re able to enter the postseason healthy.
Below, I’m offering up projections done a couple different ways. The first is built on the similarity scores I’ve posted after the past week. This approach finds players in NBA history with similar production at a similar age, and then looks at what they did in subsequent seasons. Those findings are then applied to the Wizards roster and combined with a playing time estimate for each player.
For this estimate (and the other one, which I’ll get to later in this post), I’ve used my overall metric Player Production Average (PPA), which is calibrated to explain individual player contributions to winning and losing. PPA is pace neutral, accounts for defense, and includes a “degree of difficulty” factor based on the level of competition a player faces while on the court. In PPA, 100 = average, higher is better, and 45 = replacement level.
Statistical Doppelganger Projection
POS
PLAYER
MIN
LAST SEASON PPA
PROJECTED PPA
PROJECTED kWins
PG
John Wall
2812
139
156
9.0
C
Marcin Gortat
2464
154
132
6.7
SG
Bradley Beal
2325
96
112
6.1
SF
Paul Pierce
1800
139
108
4.0
SF
Otto Porter
1800
15
85
3.2
PF
Kris Humprhies
1608
132
133
4.4
F/C
DeJuan Blair
1450
97
97
2.9
PF
Nenê
1430
102
90
2.7
PG
Andre Miller
1165
86
65
1.6
G/F
Glen Rice Jr.
1029
20
78
1.2
F/C
Drew Gooden
1002
106
100
2.1
G/F
Martell Webster
1000
77
74
1.5
POS
TEAM
19885
107
110
45.4
MIN = projected TOTAL minutes for the upcoming season
Projected kWins = how many wins that player will contribute based on his projected PPA and projected total minutes.
Over the past few seasons, the Wizards’ front office has converted the team from being one of the league’s youngest to being one of the league’s oldest. Gortat, Nenê, Pierce, Gooden and Miller all figure to play prominent roles this season, and all are past 30. Well past 30 for Pierce and Miller.
Projections for Porter and Rice were difficult because they played so little last season. For both, I elected to throw out their rookie numbers and rely instead on projections based on the rookie seasons of the players they were most like from college. Using the rookie numbers would lower Porter’s projected PPA to 66 and Rice’s to 30. That would drop Washington’s projected win total 43.8.
Note that I didn’t include Kevin Seraphin, Garrett Temple or Rasual Butler in the above table. They’ll get some minutes along the way, but — barring several catastrophic injuries — none should see enough court time to have a major effect on the team’s fortunes. For those interested, this is what I project for the end-of-the-bench trio:
Garrett Temple: 33
Kevin Seraphin: 49
Rasual Butler: 55
I can hear the cockeyed optimists already: “Why do you just assume the old guys will get worse? What if they maintain for a year?” Quick answer (and one I’ve given before): athletes past 30 tend to two things — get hurt and get worse.
But, let’s say the “Ancients” are able to do this season what they did last year. In that event, Washington’s projected win total would climb to 48.5. Which would be hella fun.
On the other hand, there are scenarios where there are more injuries than expected, younger players don’t make anticipated improvements and/or older players decline more steeply. That gives a potential “bottom” of 40.7 wins.
Simple Rating System Projection
POS
PLAYER
MIN
LAST SEASON PPA
SRS PROJECTED PPA
PROJECTED kWins
PG
John Wall
2812
139
143
8.3
C
Marcin Gortat
2464
154
144
7.3
SG
Bradley Beal
2325
96
111
5.3
SF
Paul Pierce
1800
139
117
4.3
SF
Otto Porter
1800
15
63
2.3
PF
Kris Humphries
1608
132
133
4.4
F/C
DeJuan Blair
1450
97
135
4.0
PF
Nene Hilario
1430
102
102
3.0
PG
Andre Miller
1165
86
108
2.6
G/F
Glen Rice
1029
20
82
1.7
F/C
Drew Gooden
1002
106
118
2.4
G/F
Martell Webster
1000
77
102
2.1
G/F
Rasual Butler
0
63
81
0.0
C
Kevin Seraphin
0
35
53
0.0
G
Garrett Temple
0
24
54
0.0
POS
TEAM
19885
107
117
47.9
The guys over at Basketball-Reference have up Simple Rating System projected stats for everyone who played in the NBA last season. Go here for an explanation. They don’t estimate minutes, which I can understand because it’s frigging hard to do.
The SRS approach is more optimistic than the one I used — at least at the bottom line. SRS generally predicts less of a decline for older players, but also not as much improvement from the younger ones. The SRS approach would suggest the Wizards will win 48 games this season — with a low end prediction of 43 and a high of 52.
Here’s a table comparing results from the two approaches:
POS
PLAYER
DOPP PPA
SRS PPA
DOPP kWINS
SRS kWINS
PG
John Wall
156
143
9.0
8.3
C
Marcin Gortat
132
144
6.7
7.3
SG
Bradley Beal
112
111
6.1
5.3
SF
Paul Pierce
108
117
4.0
4.3
SF
Otto Porter
85
63
3.2
2.3
PF
Kris Humprhies
133
133
4.4
4.4
F/C
DeJuan Blair
97
135
2.9
4.0
PF
Nenê
90
102
2.7
3.0
PG
Andre Miller
65
108
1.6
2.6
G/F
Glen Rice Jr.
78
82
1.2
1.7
F/C
Drew Gooden
100
118
2.1
2.4
G/F
Martell Webster
74
102
1.5
2.1
G/F
Rasual Butler
55
81
0.0
0.0
C
Kevin Seraphin
49
53
0.0
0.0
G
Garrett Temple
33
54
0.0
0.0
DOPP PPA = projected PPA using the Statistical Doppelganger approach
SRS PPA = projected PPA using the Simple Rating System numbers published by Basketball-Reference
DOPP kWINS = projected individual wins contributed using the Statistical Doppelganger approach
SRS kWINS = projected individual wins contributed using the Simple Rating System numbers published by Basketball-Reference
Final Word
In the end, I’m using my own projection system. Last year, I projected the Wizards would win 43 — they won 44, albeit not exactly in ways that I expected. I’ve refined my projection system (I hope), although I’m hoping the team outperforms my prediction by a wide margin.
While still lacking an elite producer, the Wizards could be a tough out in the playoffs when rotations shorten and there’s more rest between games (especially in the first round). If they can get there healthy, of course.
I’m projecting the Wizards will win between 41 and 48 games this season. Final projection: 45 wins and the fifth seed in the Eastern Conference playoffs.
In my last post, I alluded to a kind of parting of the seas for the Wizards in the Eastern Conference playoffs. The reasoning is pretty simple: the Wizards should be considered strong favorites over either the Pacers or the Hawks. That’s right, either.
If this was a “normal” NBA season, Washington would be a heavy underdog to the top seeded Pacers. But, if this was a “normal” season, the Wizards wouldn’t have been the fifth seed with 44 wins, Atlanta wouldn’t have been in the playoffs with a sub-.500 record, and Indiana wouldn’t have disintegrated over the last two months of the season (and wouldn’t have had to fight and claw to get to a seventh game against such a pedestrian opponent).
This is an abnormal season, though, and the weak Eastern Conference coupled with the stumble-bum Pacers at the top have given the Wizards their best chance of reaching the NBA’s final four since…1979.
That the Wizards would be favored vs. Atlanta is unsurprising. The Hawks weren’t much good during the regular season. They struggled after center Al Horford tore a pectoral muscle (again), and limped into the playoffs. The Pacers need a bit more explanation — which I provided nearly a month ago when I wondered whether Washington should tank for seventh so they could face Indiana in the first round.
If you want more detail, please click and read on that link. The upshot is this: since the All-Star break, the Pacers have been a very different team. They’ve actually had a negative scoring differential, which is something I don’t think I’ve ever seen for an extended stretch from a highly seeded team. Indeed, since the All-Star break, the Pacers have had the scoring differential of a 34-win team (over an 82-game schedule), just one game better than the eighth seed Hawks. Over that same time frame, Washington’s differential was that of a 52-win team.
Don’t go getting too excited about that differential: the Wizards played an incredibly easy schedule after the All-Star break. Still, it’s illustrative of the significant changes in the Eastern Conference. Since that All-Star break, the Wizards had the third best efficiency differential of the East’s playoff teams. The Pacers had the second worst.
So, what are the odds? Applying a combination of full season numbers, post All-Star break numbers, and playoff performance, I estimate Washington having the following chances of beating these possible Eastern Conference playoff opponents:
Indiana — 64%
Miami — 27%
Toronto — 50%
Chicago — 100%
Washington — 0%
Brooklyn — 67%
Charlotte — eliminated
Atlanta — 81%
The odds will fluctuate a bit after that seventh game, but the fundamental point remains: Washington is in a terrific position to reach the Eastern Conference Finals. Getting farther is a dicier proposition, especially if they end up facing Miami.
Round One Wrap-Up
The 4-1 first round win over the Chicago Bulls is done, but there are still a few points worth making. While there’s been some chatter about how flawed the Bulls are (including by me), Chicago actually looked pretty strong entering the post-season. It’s trademark defense was excellent down the stretch, and its offense was about average. The Eastern Conference team with the best efficiency differential after the All-Star break? The Bulls.
Washington’s first round victory wasn’t a case of getting a crappy opponent, it was a case of the Wizards outplaying a decent team. Give credit where it’s due: a big reason the Bulls looked so bad is that the Wizards were on their game.
Finally, here’s a look at the Player Production Averages (PPA) for the series. PPA is an overall rating metric I developed that credits players for things they do that help a team win, and debits them for things that don’t. It’s a per-minute stat that’s pace-neutral, accounts for defense, and includes a “degree of difficulty” factor based on the level of competition a player faces while on the floor. In PPA, 100 = average, higher is better, and 45 = replacement level. (Don’t pay much attention to the extreme scores at the bottom of the table — tiny sample sizes don’t mean much of anything.)
TEAM
Player
GMS
MPG
PPA
CHI
Taj Gibson
5
30.8
210
WAS
Trevor Ariza
5
39.0
193
WAS
Bradley Beal
5
41.0
152
CHI
Mike Dunleavy
5
32.6
139
WAS
Trevor Booker
5
24.2
134
WAS
John Wall
5
38.6
128
WAS
Martell Webster
5
18.0
113
WAS
Nene Hilario
4
35.8
107
CHI
Joakim Noah
5
42.0
97
WAS
Marcin Gortat
5
36.0
97
CHI
Jimmy Butler
5
43.6
88
CHI
Carlos Boozer
5
24.2
58
CHI
Kirk Hinrich
5
33.4
22
WAS
Andre Miller
5
10.4
10
CHI
D.J. Augustin
5
28.2
5
WAS
Kevin Seraphin
1
1.0
0
WAS
Drew Gooden
4
9.0
-35
CHI
Tony Snell
5
9.2
-47
CHI
Nazr Mohammed
2
2.5
-189
WAS
Al Harrington
3
2.3
-364
WAS
Garrett Temple
4
0.3
-1889
Interesting that the most productive player in the series was Taj Gibson, who played just 30.8 minutes per game. Meanwhile, Chicago started Carlos Boozer and played him 24.2 minutes per game despite production that wasn’t much better than replacement level.
Also interesting to me is how the production numbers differ from popular perception. One “experts” poll named Nenê as Washington’s first round “MVP.” When it comes down to doing the things that cause teams to win, he rated sixth best for the Wizards — behind Ariza, Beal, Booker, Wall and Webster.
In total, eight players rated “above average” in this series. Six of those players wore Wizards uniforms. While Gibson was good throughout the series, the only other Bull above average was Dunleavy, and most of his production came in a single game.
Last week, I estimated the Wizards’ odds of winning a seven-game series against the teams most likely to make the Eastern Conference playoffs. It was a useful exercise in seeing how Washington stacks up against possible opponents, but it used numbers from the full season, which means my approach didn’t necessarily capture team form lately.
And, the performance of the other seven teams in the playoffs has changed markedly in some cases since the All-Star break. The biggest shift has been the Indiana Pacers meltdown. After opening the season with a 40-12 record, Indy has gone just 13-13 after the All-Star break. More worrisome for the Pacers: they’ve had a negative efficiency differential over the past 26 games — despite an easy schedule.
Let me say that another way: since the All-Star break, the Pacers have been outscored by their opponents. The only other Eastern Conference playoff team to do that — the New York Knicks.
The decline has been an across the board failure for Indiana. Both their offense and defense have gotten worse, neither is showing much sign of improvement, and it may create an “upset” opportunity for whoever gets that seventh seed.
Using team stats since the All-Star break, the Pacers have the scoring differential of a 32-win team (over an 82-game schedule). That’s the weakest performance of any Eastern Conference team by eight games. Next closest is New York, which has played like a 40-win team. Over the same stretch, the Wizards have played like a 47-win team.
So, what’s wrong with Indiana? First, there may have been some significant overrating based on last year’s playoffs. In 2012-13, the Pacers were good-but-not-great during the regular season. Then they went on a strong playoff run. Before this season, the guys over at Boxscore Geeks cautioned that many were overreacting to those playoffs, and projected Indy as a sub-.500 team. That prediction wasn’t so great either — even with their crummy post-All-Star break performance, Indy has 53 wins, but the Boxscore Geeks made a critical point — the Pacers were being crowned as championship contenders without top-end talent, without a season’s worth of sustained excellence — without demonstrating they could consistently play at a championship level.
Early in the season, Indy looked like it would be a worthy rival for the Heat, but that’s old news. Why? There are few “big” things that jump out. Their offensive decline has been significant, but it seems to be an accumulation of little things — a slight decline in their shooting and a narrower rebounding margin.
What’s really making them vulnerable has been the drop in their defensive efficiency. The numbers practically leap off the screen. There are four key categories that define who wins basketball games — shooting, ball handling (turnovers), rebounds, and getting to the free throw line. The Pacers have been worse at all four on defense since the All-Star break. The most significant drop has been in the most important category: shooting.
To make this even simpler, since the All-Star break Indiana has shot worse, has allowed their opponent to shoot significantly better, has grabbed fewer defensive rebounds, and has forced fewer turnovers. While none of the changes is major (except defensive efg), the across-the-board declines add up.
Looking at the individual players suggests that there’s plenty of “blame” to go around. Roy Hibbert is probably first in line — his production (as measured by my stat, Player Production Average (PPA) — where 100 = average, higher is better, and replacement level = 45) is a shade below league average. His PPA of 98 is down 32 from last season, and 57 from two seasons ago. But, David West’s PPA is down 25, and George Hill’s is down by 20.
Paul George and Lance Stephenson are both improved from last season (George from a 133 to a 164; Stephenson from a 94 to a 121), BUT both are down significantly from pre-All-Star production levels. Through the first 25-30 games, George was posting an All-NBA level 200+ PPA. Stephenson was in the 150 range, which is roughly All-Star level.
And oh yeah, the team has also been hurt by roster decisions that weakened their bench. Specifically, they let Tyler Hansbrough (PPA: 82) depart, and replaced him by trading for Luis Scola (PPA: 43). Ian Mahinimi continues to be terrible. And, the trade for Evan Turner has been a predictable debacle.
All of this is a fairly long way of saying that the Wizards might be smart to position themselves as the seventh seed in the East. The Pacers could pull things back together and play as they did earlier in the season, but their recent performances don’t indicate that’s likely. If recent performance levels continue into the playoffs, Indiana could be in for a short, embarrassing 2014 postseason — no matter who they face.
Now for the payoff to that Upworthy headline: Mike Wise is right. Well, his basic conclusion that Grunfeld will keep his job is correct. But just about everything else he wrote? Ill-informed, error-riddled, poorly reasoned garbage.
Among the barbershop banter going around Verizon Center’s media room Wednesday night was the topic of which Washington Wizards small forward had to go in the offseason to avert a talent-and-minutes logjam: Trevor Ariza, Martell Webster or Otto Porter Jr.?
By the time arguments were made on each player’s behalf (given his age and upside, everyone agreed moving Porter after his rookie year would be downright foolish), it dawned on the half-dozen or so of us: We were talking about players who might have to leave Washington because of too much depth at their position. No one could remember such a discussion about a Wizards roster this decade.
This was when I realized Ernie Grunfeld had definitely saved his job.
Several things are downright amazing in these four sentences. Face palm “amazing,” not “John Wall just threw down a breakaway 360 windmill” amazing.
First, mediaites are just now talking about the Wizards having a lot of guys at small forward? Second, this is somehow a good thing? And third: it took Wise until March 5 to “realize” Grunfeld’s job was saved?
Yeah, the Wizards do have a theoretical logjam at SF. People paying attention to the Wizards recognized a potential logjam at that spot before last year’s draft. That’s before the team selected Otto Porter — which was as predictable as…well…Wise writing an inane column for the Washington Post.
That potential logjam — recognized before last year’s draft — called into question the Wizards’ entire offseason strategy. Picking Porter to play SF was a fine move, especially if you’re a “best player available” proponent (as I am). Trading two second round picks for one and selecting SG/SF Glen Rice Jr. was another perfectly acceptable move. Keeping Trevor Ariza for the final year of his contract (instead of trading him) was also a fine move, as was re-signing Martell Webster.
What was decidedly NOT sensible was doing all four in the same offseason. And, a number of smart observers who pay attention and give actual thought to how to construct a good NBA team have been saying so since June 2013.
Grunfeld’s choice to invest so many resources at one position left the Wizards lacking depth up front, which was yet another thing that concerned fans who were paying attention. Washington was counting on two 30+ year old bigs, and 30+ year old athletes predictably do two things: get hurt and get worse.
What happened? Thirty-one year old Emeka Okafor got hurt before the season started, which meant that the Wizards NEEDED to acquire a replacement if they hoped to salvage their season. We’ll get into that in more detail very soon.
Meanwhile, 31-year old Nenê hit the 30+ exacta by both declining AND getting hurt.
More from Wise:
On a playoff-or-bust edict from his owner since training camp, out of injury alibis and facing the prospect of no postseason for a sixth straight spring, the oft-slammed team president launched a deep three-pointer in late October.
Grunfeld acquired a journeyman center from Phoenix and some loose change for an injured Emeka Okafor and a protected first-round draft pick.
That player, Marcin Gortat, has started 60 of 61 games this season.
Gortat has double figures in points and rebounds in 24 of those games.
He has bailed out his team down low, especially now that his bookend 6-foot-11 big man, Nene, is out for at least another month because of a sprained knee ligament. When Nene is healthy, the two play off each other brilliantly; the more Gortat bangs inside on offense, the more Nene can do his ballet outside the key.
That first paragraph is pure sophistry. Trading for Gortat wasn’t a “deep three,” it was a layup, a sure thing. Ditto for the trade to obtain Okafor and Ariza. Wise is suggesting that Grunfeld was taking a chance to get the team back in the playoffs. A competent GM would have addressed the team’s glaring need for frontcourt depth during the offseason instead of burning all of his assets on small forwards and a backup point guard who had been demonstrably terrible for four seasons.
The trade for Gortat isn’t evidence of Grunfeld’s executive acumen, but prime evidence of his incompetence. When the team’s starting center was out of commission, they couldn’t turn to their bench and have even a reasonable hope that the next man up could do an adequate job. Nope, they had to burn a future asset — likely to be in one of the deepest, most talented drafts of the past decade — to achieve the very modest short-term goals for this season.
“With March and Nene, we can match up with anybody inside,” Grunfeld said at halftime of a victory over the Jazz on Wednesday night as he leaned against a wall in the club suite where he watches games.
“It was big at that time we made the trade because we knew Emeka was hurt. To bring in a big guy who plays both offense and defense and has a very positive attitude, we were very happy.”
Ernie won’t talk about his future, pleading that I write about something else. Ted Leonsis won’t talk about Ernie’s future, just as he won’t talk about George McPhee’s future with the Capitals. All Monumental Sports business apparently will be handled this summer.
But while McPhee may need a Stanley Cup playoff run of at least two or more rounds to warrant an extension, the signs of Grunfeld being re-signed are growing daily.
ESPN has calculated the odds of Washington returning to the playoffs for the first time since 2008 as 100 percent (since Golden State and Portland don’t yet have that designation, it apparently does help to play in the Eastern Conference).
I’ve already addressed the content of the Grunfeld quotes. What he says is accurate enough, if looked at in a vacuum. The trade for Gortat (which cost the team a future first round pick) wouldn’t have been necessary if they’d done a reasonable job of adding depth in the offseason. Or, if they’d used the cap space they traded for Okafor and Ariza to get younger players that could be just as productive and have the prospect of improving.
It was nice to see Wise at least acknowledge the benefits of playing in the weak sister Eastern Conference. To add some teeth to the aside, keep in mind that Washington’s record (compiled against the league’s 8th easiest schedule) would rank 10th in the Western Conference. At 32-29, they’d be four games out of 8th place.
Realistically, Washington’s record would be worse in the tougher conference. In my analysis, they’d fall 11th. In the East, they’re fourth or fifth.
More from Wise:
I’ll admit it: I thought Ernie was finally toast. Though I’ve consistently defended him on essentially the same grounds Leonsis has used — Grunfeld is executing the gradual rebuilding plan his employer instructed him to — I wasn’t sure he could recover from re-signing Gilbert Arenas and Andray Blatche to a combined $146 million in 2008 and 2010.
But the recycling king did it, turning Arenas into Rashard Lewis, then into Okafor and Ariza (a trade widely criticized as the Wizards taking on two aging role players for too many guaranteed years and millions) and finally Okafor into Gortat.
The first paragraph from this excerpt is absurdity. The Wizards talked about doing a gradual rebuild, but when presented with resources to acquire young, productive players with a future, they instead traded for older players who could speedwalk them back to mediocrity.
The Arenas for Lewis trade was a solid move. Trading the cap space for older players was shortcutting the rebuild.
Note that last line: “…and finally Okafor into Gortat.” No, it was Okafor AND a first round pick for Gortat. Here’s the total price: maximum cap space, a future first round pick and a future second round pick for Ariza and Gortat. And, if the Wizards want them back, it’ll cost them max cap space again.
More Wise:
This is a very good core group, with its two best players 20 and 23 years old, respectively. The Wizards have put themselves in position salary-cap wise to spend in free agency the next two seasons.
Everything here is wrong. The core group is not “very good,” it’s average. Its best players are 28 and 23 (Ariza and Wall). The Wizards have NOT put themselves in a good position to spend in free agency. The last point is one I addressed last November.
To summarize: the Wizards won’t be in position to ADD to their team via free agency. If they’re to have significant cap room to sign a “name brand” free agent, they’ll have to let Gortat, Ariza and Booker depart. If those guys leave, Washington will need to REPLACE them. If they re-sign Gortat and/or Ariza and/or Booker, they won’t have cap space to pursue a significant free agent.
Now, the team could re-sign Gortat and Ariza (and maybe Booker too), and then go shopping in free agency using the MLE. Then they’d be adding. But, they’d also then be tied to two 30+ year old big men (Gortat and Nenê), who would more likely be declining as Wall, Beal and (maybe) Porter are approaching their potential.
More Wise:
As time has gone on, the bigger picture of Grunfeld’s vision is beginning to emerge. Taking on Nene’s $65 million deal or the remaining $15 million of Ariza’s deal appeared risky, if not foolish, in 2012. But without those pieces and Gortat surrounding John Wall and Bradley Beal, the Wizards aren’t three games over .500 for the first time since the Arenas era and less than two months from possibly their first playoff series win since 2005.
Vision? There’s no vision here. The team is the assemblage of a man trying to save his job. There’s little apparent thought given to a long-term goal like building a championship contender.
The stuff about Ariza, Nenê and Gortat supposes that those were the only moves available. What’s more, getting these players (instead of younger guys who might grow with Wall and Beal) is indictment of Grunfeld’s alleged vision. Gortat and Ariza must be re-signed — re-acquired at the cost of a second helping of maximum cap space. And, as some (including myself) predicted, Nenê is in the expensive, injured, decline portion of his career.
And this is before even getting to the bungling that made trading for veterans a consideration in the first place. When Washington dealt for these guys, younger players — all of whom were selected by Grunfeld — were setting new standards for ineptitude.
Wise writes:
With Joe Dumars reportedly on his way out in Detroit, Grunfeld would have the fifth-longest tenure among NBA GMs behind Miami’s Pat Riley, the Lakers’ Mitch Kupchak, San Antonio’s R.C. Buford and Boston’s Danny Ainge.
Yes, Grunfeld’s the only one on that list without an NBA title. He’s also the only one who was expressly told to do it on the cheap for a few years.
More sleight-of-hand sophistry. Note the use of “…an NBA title,” as if Grunfeld’s team was oh-so-close, but just fell short. So, let’s compare the records of the longest-tenured GMs:
NBA RANK
TEAM
GM
W
L
W-L%
1
SAS
Buford
611
254
.706
3
LAL
Kupchak
520
346
.600
4
MIA
Riley
515
348
.597
8
BOS
Ainge
472
392
.546
11
DET
Dumars
458
407
.529
28
WAS
Grunfeld
345
520
.399
Perhaps you’ll notice what I did — during the time Grunfeld has been in charge of the Wizards, they’ve had the league’s third WORST winning percentage. In that same timespan, those who have been in place longer have run three of the league’s most successful franchise. And the fourth guy — the one reportedly close to being fired — guided a franchise that was one of the NBA’s best for a seven-year span, and which won a championship.
What’s remarkable to consider is that 22 other NBA franchises were better than the Wizards teams Grunfeld assembled…and replaced their GM.
Wise blathers:
He doesn’t get a pass for drafting Jan Vesely at No. 6 or Oleksiy Pecherov at No. 18. He’s also not the only NBA executive who didn’t take Stephen Curry before No. 7 or DeJuan Blair before No. 37 in 2009.
But, apparently in Wise’s book, Grunfeld does get a pass for picking Chris Singleton ahead of Kenneth Faried, for signing Eric Maynor, or for trading the 5th pick for Mike Miller and Randy Foye.
Wise bleets:
Here’s hoping those in the Why-Isn’t-Grunfeld-Gone? mob can lower their pitchforks and finally notice the team in front of them.
Last month in Sochi, Russia, I ran into a former acquaintance of mine and Grunfeld’s who, within minutes, wanted to know, “How does Ernie still have a job?” I’ve heard this often the past few years, often from people looking for work themselves.
Now that the Wall era is within weeks of its first postseason, the answer is easy: Ernie Grunfeld and his closest advisers were given just the right amount of time they needed to fix what was broke.
For this year, the team is enjoyable to watch. But, those who pay attention to the team know that scaling Mt. Mediocrity this season (and really, it was supposed to be scaled last season, but…you know…that injury to Wall and (this may sound familiar) lack of depth) comes at the expense of the team’s future.
They spent their cap space on older players. To keep those older players, they’re going to have to spend even more cap space.
Because one of those older players got hurt (and they hadn’t obtained a solid reserve big man despite a glaring need for depth), they had to spend a future first round pick (probably in a deep draft) to get another older player.
Because they flunked player evaluation, they had to spend their biannual exception, a previous (failed) first round pick, AND a future 2nd round pick to get an “on his last legs” backup PG.
This kind of twaddle from Wise is what I expected from casual fans when the Wizards punted on the rebuild and instead went all-in for mediocrity. What the team did was cynical in my view — they created an illusion of improvement, not by doing a genuine rebuild with younger players who have a future, but by spending resources on established players on short contracts.
It’s not about lowering pitchforks or wanting Grunfeld gone. When I’ve met Grunfeld, I liked him. In fact, I’ve liked and respected all the front office guys I’ve had a chance to meet. But they haven’t done a good job over the past decade, and there’s little reason to think they’ll abruptly improve in the future.
SBNation’s Matthew Tynan put Wall atop his list of “snubs” — a list that included Greg Monroe and Chandler Parsons. Around the web and in private conversations, the reaction from Wizards fans runs the gamut from “Wall’s been disrespected” to “well, he didn’t play all that well in that USA Basketball camp last year” to “his game isn’t well-suited to international hoops.”
The discussion of Wall and the international team goes hand-in-hand with the question posed in this RealGM message board thread: Is Wall A Top 5 PG? The answer to that question goes to the heart of player evaluation. In my rating system (called Player Production Average — PPA for short), Wall is the number two PG in the East, but ranks just 10th in the league in doing the things that cause teams to win.
This result puzzles many fans, who watch the games and see the basic (and not very useful) stats presented during game broadcasts. It’s easy to understand why “watchers” hold Wall in such high esteem — he’s an active, dynamic player who does lots of stuff during the course of a game. And those per game stats are good too.
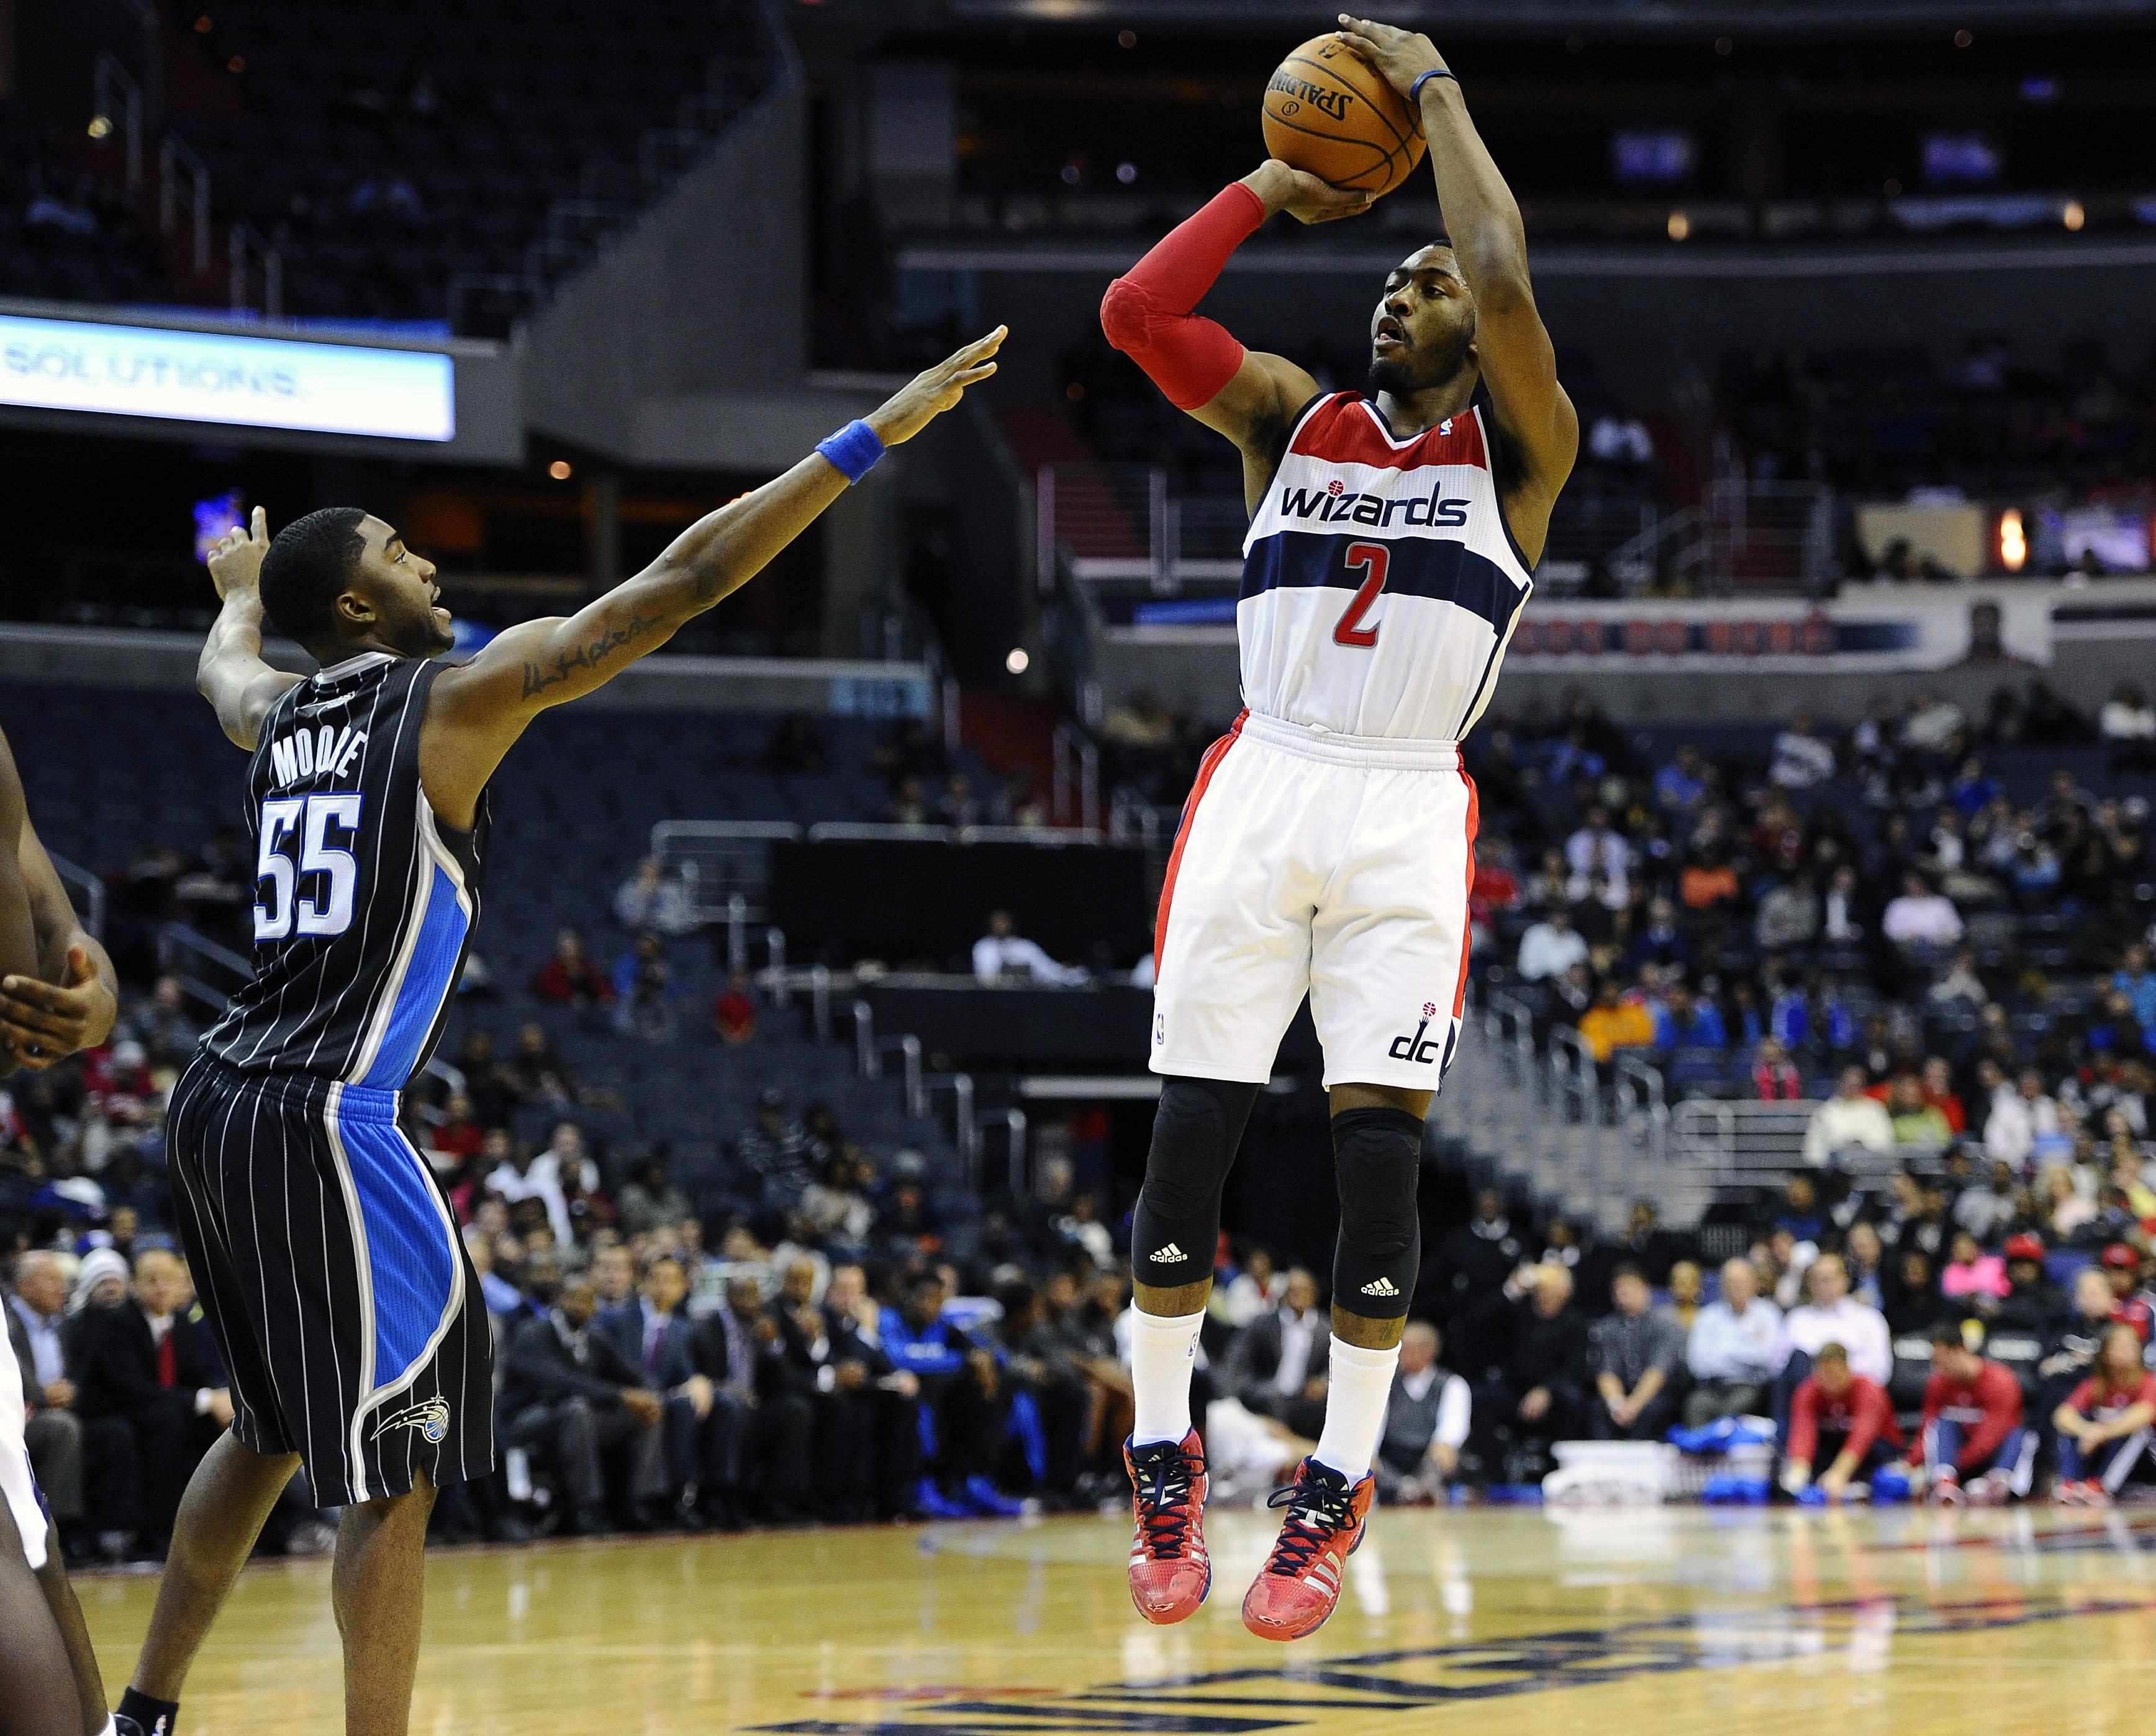
What’s the disconnect? Some fans (and perhaps some talent evaluators as well) pay attention to the good stuff a player does while discounting (or ignoring completely) the negatives. For an example, look at last night’s overtime loss to the Boston Celtics. Wall posted a triple-double — 28 points, 11 rebounds and 10 assists, and he added 3 steals to boot. The storyline from the game: Wall’s triple-double wasn’t enough because…fill in the blank (the Wizards bench was bad; Nenê isn’t what he used to be; Randy Wittman is a bad coach; Beal is still on his minutes limit).
What’s being left out is that Wall’s triple-double included 20 missed FGA, 6 turnovers, and 5 fouls. In a game where the Wizards produced an offensive rating (points per possession x 100) of 101, Wall’s offensive rating was a dismal 87. And he used nearly 40% of the team’s possessions while on the floor.
To further illustrate, I made up a couple new stats: Good Plays Only (GPO) and Bad Plays Only (BPO). The formulas:
GPO = fgm + 0.5 x ftm + reb + ast + stl + blk
BPO = missed fg + 0.5 x missed ft + tov + pf
Looking at total GPO, Wall is the number two PG in the league (behind only Stephen Curry) and ranks 12th overall. If we use per minute GPO, Wall drops to 5th among PGs (Chris Paul, Russell Westbrook, Curry and Michael Carter-Williams are ahead of him) and 27th overall. Hey, top 5 right?
So, Wall does a lot of “good stuff” out there — something that likely explains why he’s so highly regarded among fans, media members and league talent evaluators. Except…these categories aren’t weighted based on what they contribute to team wins, and they don’t include negative side of the ledger. It would be akin to evaluating personal wealth by adding up our paychecks without considering bills that have to be paid.
Turning to the “bills” part of the good/bad equation, Wall has the third highest total BPO (Bad Plays Only) among PGs (Curry and Monta Ellis have higher totals), and the 8th most among all players. In per minute BPO, Wall is 5th highest among PGs (behind Westbrook, Carter-Williams, Curry, and Kyrie Irving), and 15th overall in the league.
GPO shows that Wall makes a lot of good plays. BPO shows he makes a lot of bad ones. In financial terms, he earns a lot of money, but he spends a lot too. That “spending” reduces the “balance” (so to speak) and limits his positive impact for the Wizards. He’s a good player, but he could help his team win more by reducing those negative plays (missed shots and turnovers).
One final point with this GPO/BPO stat — call it Net Good & Bad Plays (NGBP). The formula is simple: GPO – BPO. In TOTAL NGBP, Wall ranks 4th among PGs (behind Paul, Ricky Rubio, and Ty Lawson) and 29th overall. On a per minute basis, Wall ranks 5th among PGs (behind Paul, Rubio, Lawson and Westbrook), but 66th overall.
Keep in mind — there’s no weighting done on these categories based on how these stats contribute to winning and losing. In PPA, which has that weighting, Wall ranks 5th in total production among PGs and 24th in the league (high-minute players logically lead in total production). On a per minute basis, he ranks 10th among PGs and 51st in the league. That’s good, but it’s not elite. And no, it doesn’t warrant being chosen for the U.S. national team.
Shameless plug: Click on the image below to read the FREE first chapter of my new mystery novel set for release later this month.