

As Dean Oliver first wrote, there are four key factors that determine who wins and loses in the NBA. In order of importance: shooting, rebounding, getting to the free throw line and turnovers. So far this season, the data suggests that variation in efg differential accounts for about 44% of variation in scoring differential; rebounding accounts for 26%, getting to the free throw line about 18%, and turnovers about 11%.
How are the Wizards doing? They’re 25th in efg differential, 24th in rebounding differential, 9th in turnover differential and 10th in free throw differential. All that combines to rank 23rd in average scoring margin, which means they haven’t played even as well as their 19th ranked winning percentage might suggest.
At this point, Basketball-Reference forecasts the Wizards to win about 36 games and indicates the team’s odds of winning the draft lottery (2.5%) are about the same as them making the playoffs this season (2.4%).
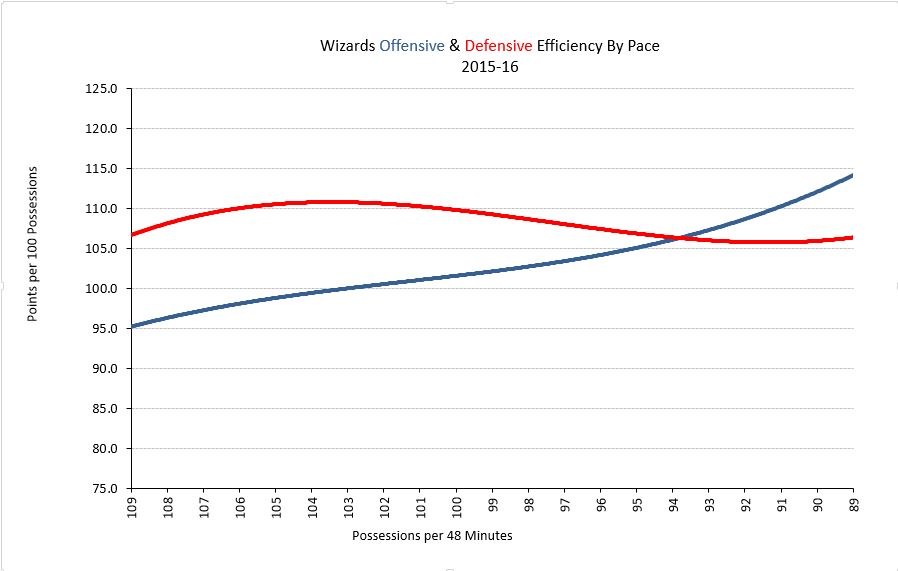
While the team embarked on an effort to play faster, the results through 25 games indicates they may still benefit by slowing down. The defense appears to be largely unaffected by pace, but the numbers suggest the team may be a bit more efficient in slower-paced games. The effect is small, but at this point the team needs every advantage it can get.
Player Production Average
The ratings below are a metric I developed called Player Production Average (PPA). In PPA, players are credited for things they do that help a team win, and debited for things that don’t, each in proportion to what causes teams to win and lose. PPA is pace neutral, accounts for defense, and includes an adjustment based on the level of competition faced when a player is on the floor. In PPA, average is 100, higher is better, and replacement level is 45.
League-wide PPA scores through games played 12/20/15 are here.
| PLAYER | GAMES | MPG | 11/10 | 11/22 | 12/3 | 12/13 | PPA |
| John Wall | 25 | 35.1 | 153 | 129 | 136 | 168 | 157 |
| Marcin Gortat | 22 | 30.2 | 91 | 112 | 128 | 133 | 132 |
| Otto Porter | 24 | 32.3 | 144 | 158 | 104 | 116 | 107 |
| Jared Dudley | 24 | 26.9 | 36 | 92 | 90 | 85 | 98 |
| Ramon Sessions | 25 | 19.7 | 131 | 119 | 84 | 90 | 87 |
| Bradley Beal | 17 | 36.5 | 128 | 108 | 96 | 87 | 87 |
| Nene Hilario | 12 | 17.4 | 58 | 90 | 80 | 74 | 79 |
| Gary Neal | 23 | 22.4 | 23 | 49 | 64 | 75 | 78 |
| Kris Humphries | 20 | 18.1 | 90 | 121 | 95 | 80 | 78 |
| Garrett Temple | 23 | 18.0 | 38 | 106 | 57 | 54 | 70 |
| Ryan Hollins | 5 | 9.6 | -40 | 60 | 59 | ||
| Drew Gooden | 6 | 12.8 | 99 | 51 | 57 | 56 | 56 |
| Kelly Oubre | 18 | 9.3 | -103 | -4 | -40 | -44 | 9 |
| DeJuan Blair | 14 | 9.5 | -345 | -129 | -112 | -45 | -34 |
As I’ve been writing seemingly for years now, the Wizards continue to lack elite production. Click over to the full league numbers and you’ll find 11 players with at least 500 minutes who have a PPA of at least 200. Wall ranks 10th among point guards, but in a virtual tie with Reggie Jackson and Rajon Rondo.
This isn’t Wall’s “fault” exactly, he’s a very good player. But he needs more help than he’s getting. Beal ranks 24th among shooting guards, Porter 16th among small forwards, Gortat 18th among centers, and Dudley 31st among power forwards.

