The Wizards are 7-2 to start the season, which ought to be cause for celebration. And, judging by media reports and fan reaction, that’s mostly what’s happening. So what’s wrong with me?
I’m unconvinced that the good record is particularly meaningful. This is not to suggest the Wizards need to apologize for the competition they’ve faced. They don’t make the schedule, and it’s not their fault that the East is possibly weaker than it was last season — when it was aggressively bad. All Washington can do is keep beating whoever’s on the calendar, which is what they’ve been doing so far.
But…I’m still concerned because of the way they’ve been winning. In sports, the best teams typically have the highest scoring differentials. The Wizards this season stand 11th in scoring differential at +2.22, which doesn’t sound bad except that their opponents have a collective scoring differential of -2.52. In other words, the Wizards are winning by less than the rest of the league against their opponents. At least so far.
There’s a strong sentiment that’s something like: Hey, the Wizards are winning games they should win, which is real progress for this franchise. To an extent, I agree. But, what often happens to an average team (and the numbers are suggesting the Wizards are pretty average) is that over time, they’ll lose games they “shouldn’t.” And there are a TON of games left on the schedule.
Some have pointed out that Washington has played so far without Bradley Beal, which is true but perhaps not as meaningful as some think. Beal was pretty average last season, and didn’t project to make a huge leap this year (at least not in my preseason analysis). Much of what I anticipated he’d provide has been produced by Garrett Temple and Rasual Butler thus far.
Perhaps the best reason to think Washington might be able to win 48-50 games this season is the good fortune of playing in a historically weak conference. Just six Eastern Conference teams have a positive scoring differential so far, and the sixth (Brooklyn) is us by one point total so far this season. All that said, in Basketball-Reference’s simple rating system (which combines scoring margin with strength of schedule), the Wizards currently sit 16th overall and 6th in the East. If they want to make some noise this season, they need to play better.
Below is the Player Production Average (PPA) update. PPA is an overall rating stat I developed that credits players for things they do that help a team win and debits them for things that hurt the cause. PPA is pace neutral, accounts for defense, and includes a “degree of difficulty” factor based on the level of competition a player faces while on the floor. In PPA, 100 = average, higher is better and replacement level is 45.
| PLAYER | GMS | MPG | LW | PPA |
| Marcin Gortat | 9 | 31.3 | 181 | 186 |
| John Wall | 9 | 35.6 | 185 | 180 |
| Paul Pierce | 9 | 27.4 | 140 | 138 |
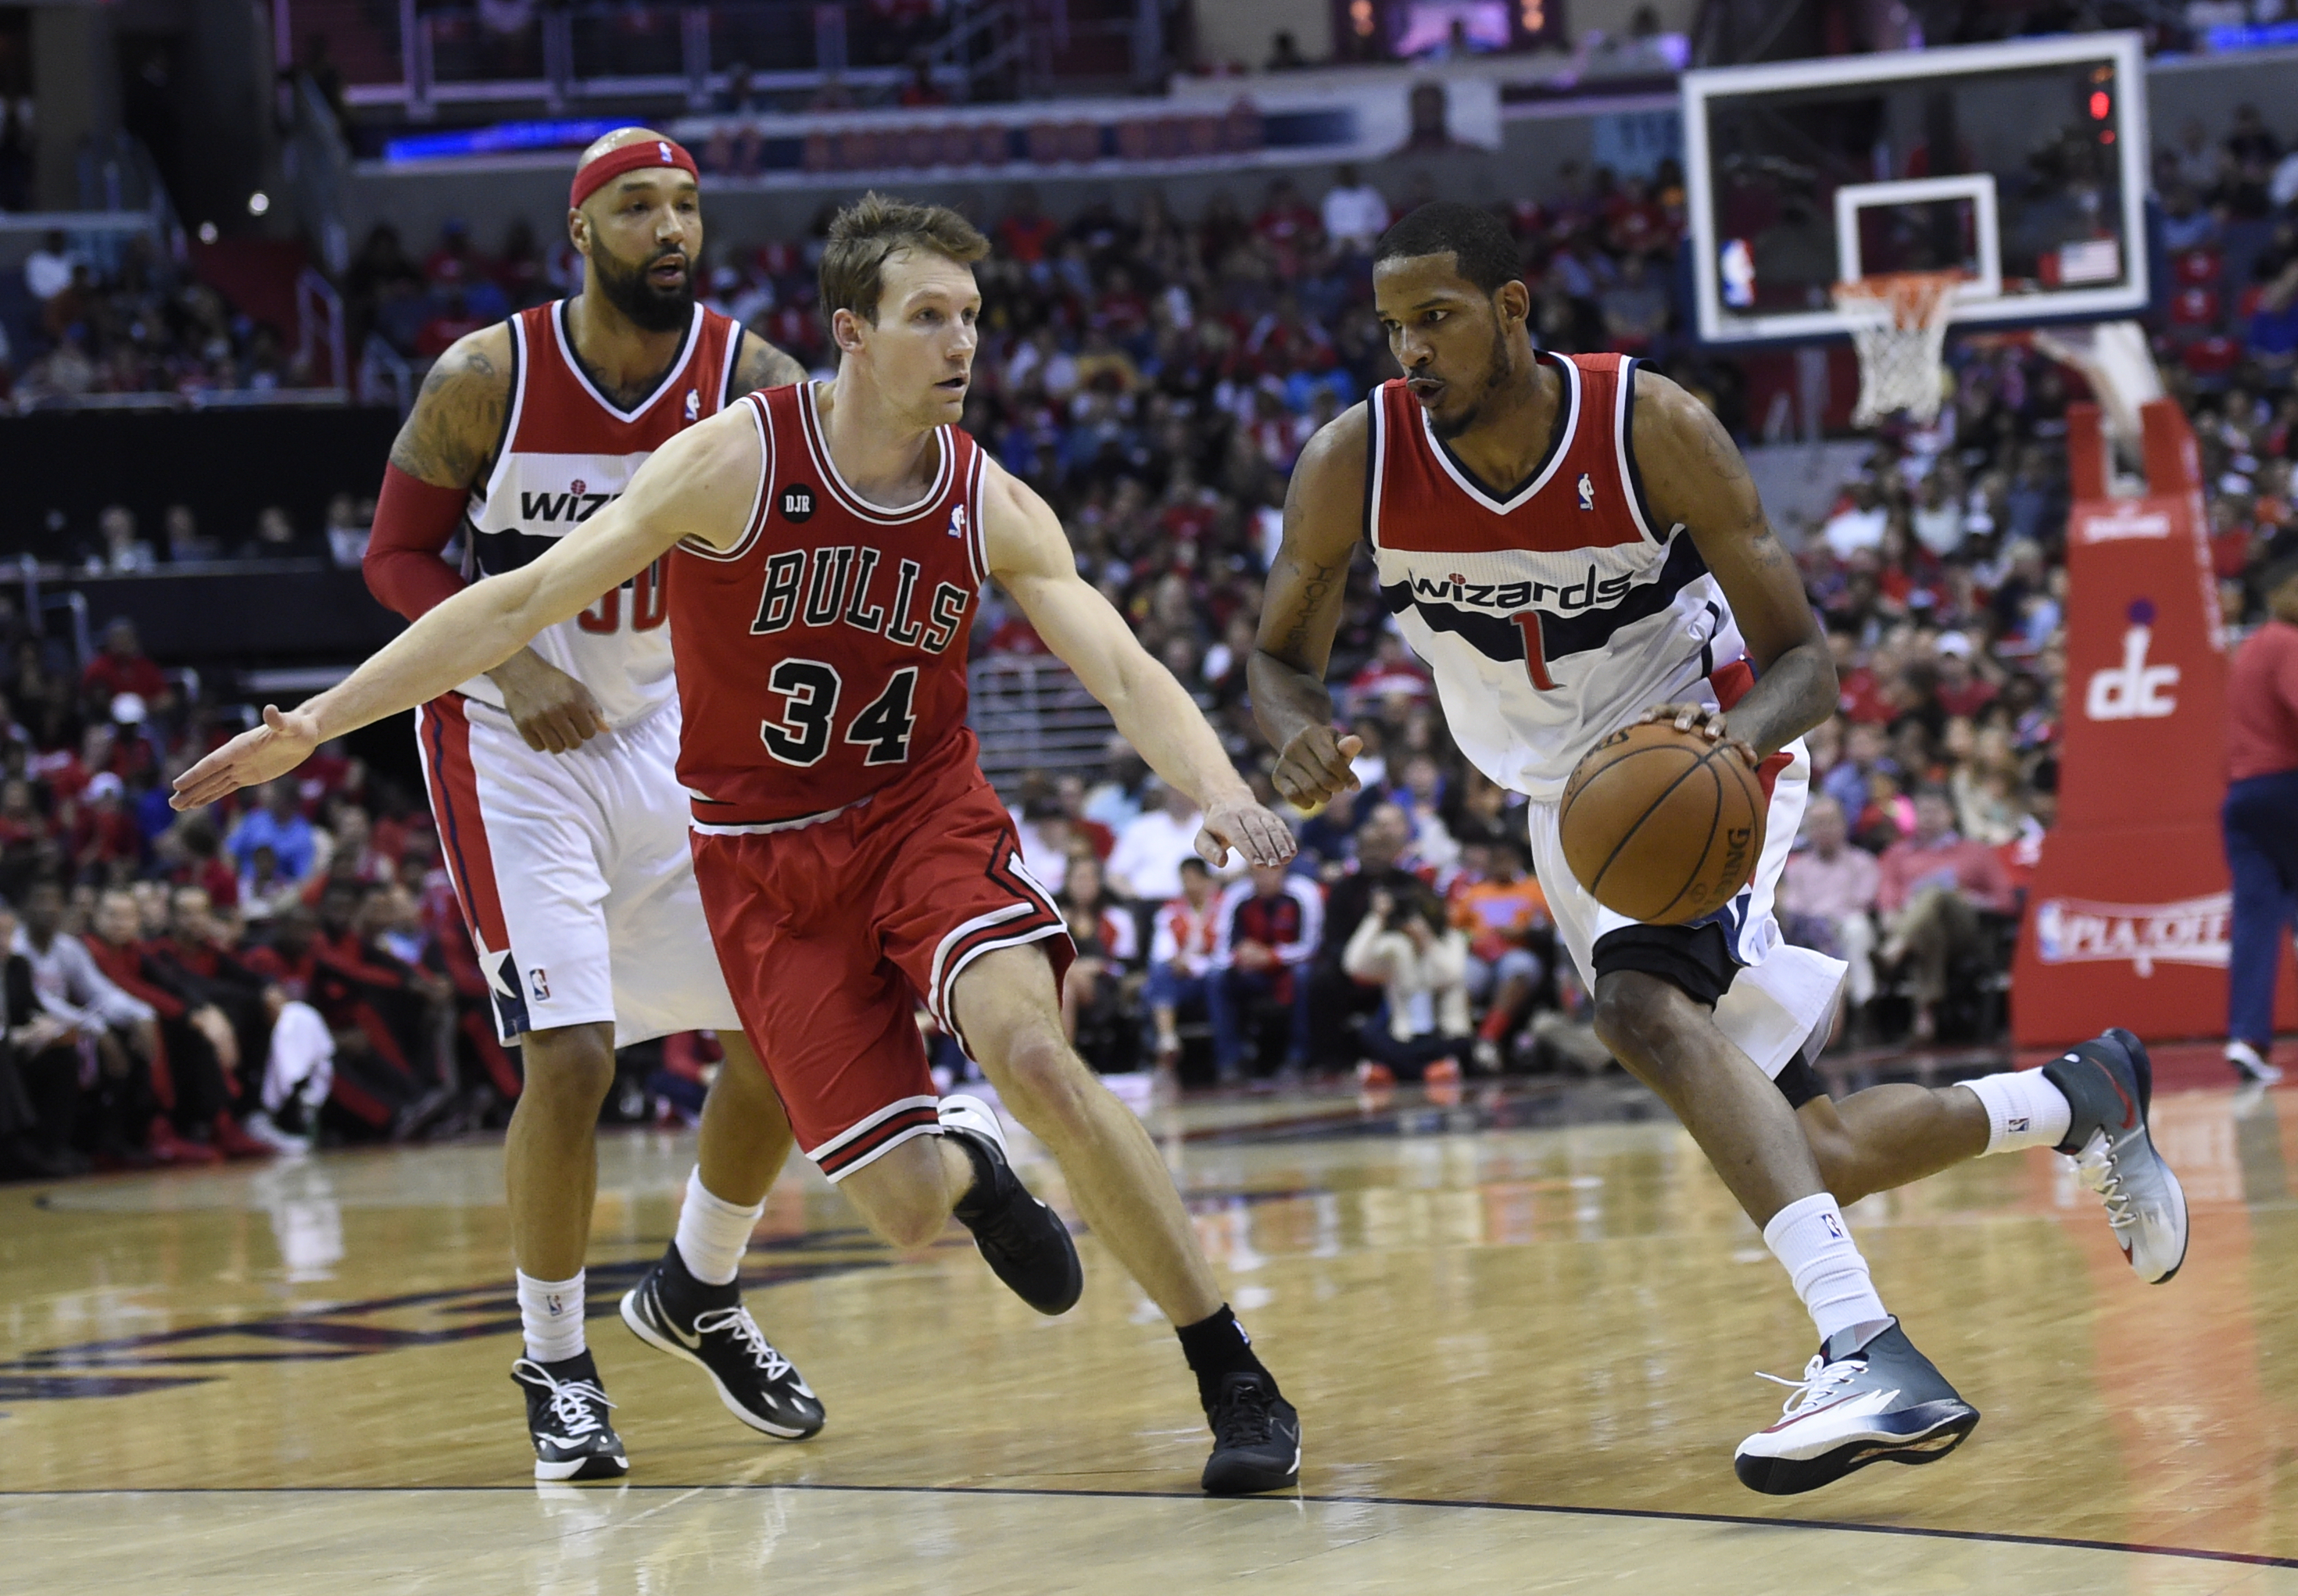
| Rasual Butler | 5 | 19.2 | 60 | 131 |
| Garrett Temple | 9 | 31.1 | 121 | 112 |
| Otto Porter | 9 | 24.2 | 97 | 106 |
| Nene Hilario | 8 | 28.6 | 108 | 102 |
| Kris Humphries | 8 | 13.9 | 46 | 87 |
| Andre Miller | 9 | 12.9 | 72 | 69 |
| Drew Gooden | 6 | 19.5 | 42 | 40 |
| Kevin Seraphin | 8 | 14.5 | 38 | 13 |
| DeJuan Blair | 3 | 3.7 | -41 | -40 |
| Glen Rice | 5 | 8.6 | -120 | -118 |
The numbers show Gortat and Wall playing outstanding basketball. Both are performing at an All-Star level. Wall could push his way into All-NBA consideration, if he continues. Gortat’s PPA is currently sixth among centers behind Tyson Chandler, Omer Asik, DeAndre Jordan, DeMarcus Cousins and Robin Lopez.
Biggest improvers this week were Butler and Humprhies. Largest drop was from Seraphin, whose field goal percentage dropped while his rebounding, turnovers and fouling remained poor.