It’s good to be a Wizards fan right now. The team is 9-3, and reasonable forecasts suggest they’re probably the second best team in their conference. That the conference is historically weak isn’t their fault. The front office put together a solid, veteran squad, and the rest of the conference backed up.
So far this season, the NBA’s collective record vs. Eastern Conference teams is 111-85. That’s a .566 winning percentage, which works out to about 46 wins over an 82-game schedule.
Against the Western Conference, the NBA’s collective record is 86-112, which is a .434 winning percentage. That means about 36 wins over an 82-game schedule.
In other words, we would expect an average team facing the East to win about 46 games…which is what Basketball-Reference forecasts for the Wizards. To highlight the relative power differential between conferences, Basketball Reference predicts the Wizards will finish the season as the second best team in the East, but with an SRS (a robust and “simple” rating system that combines a team’s scoring differential with that of its opponents) that would land it 11th in the West.
But, this is a “moment in time” snapshot. The picture changes a bit with every game played. And there are still a ton of games on the schedule.
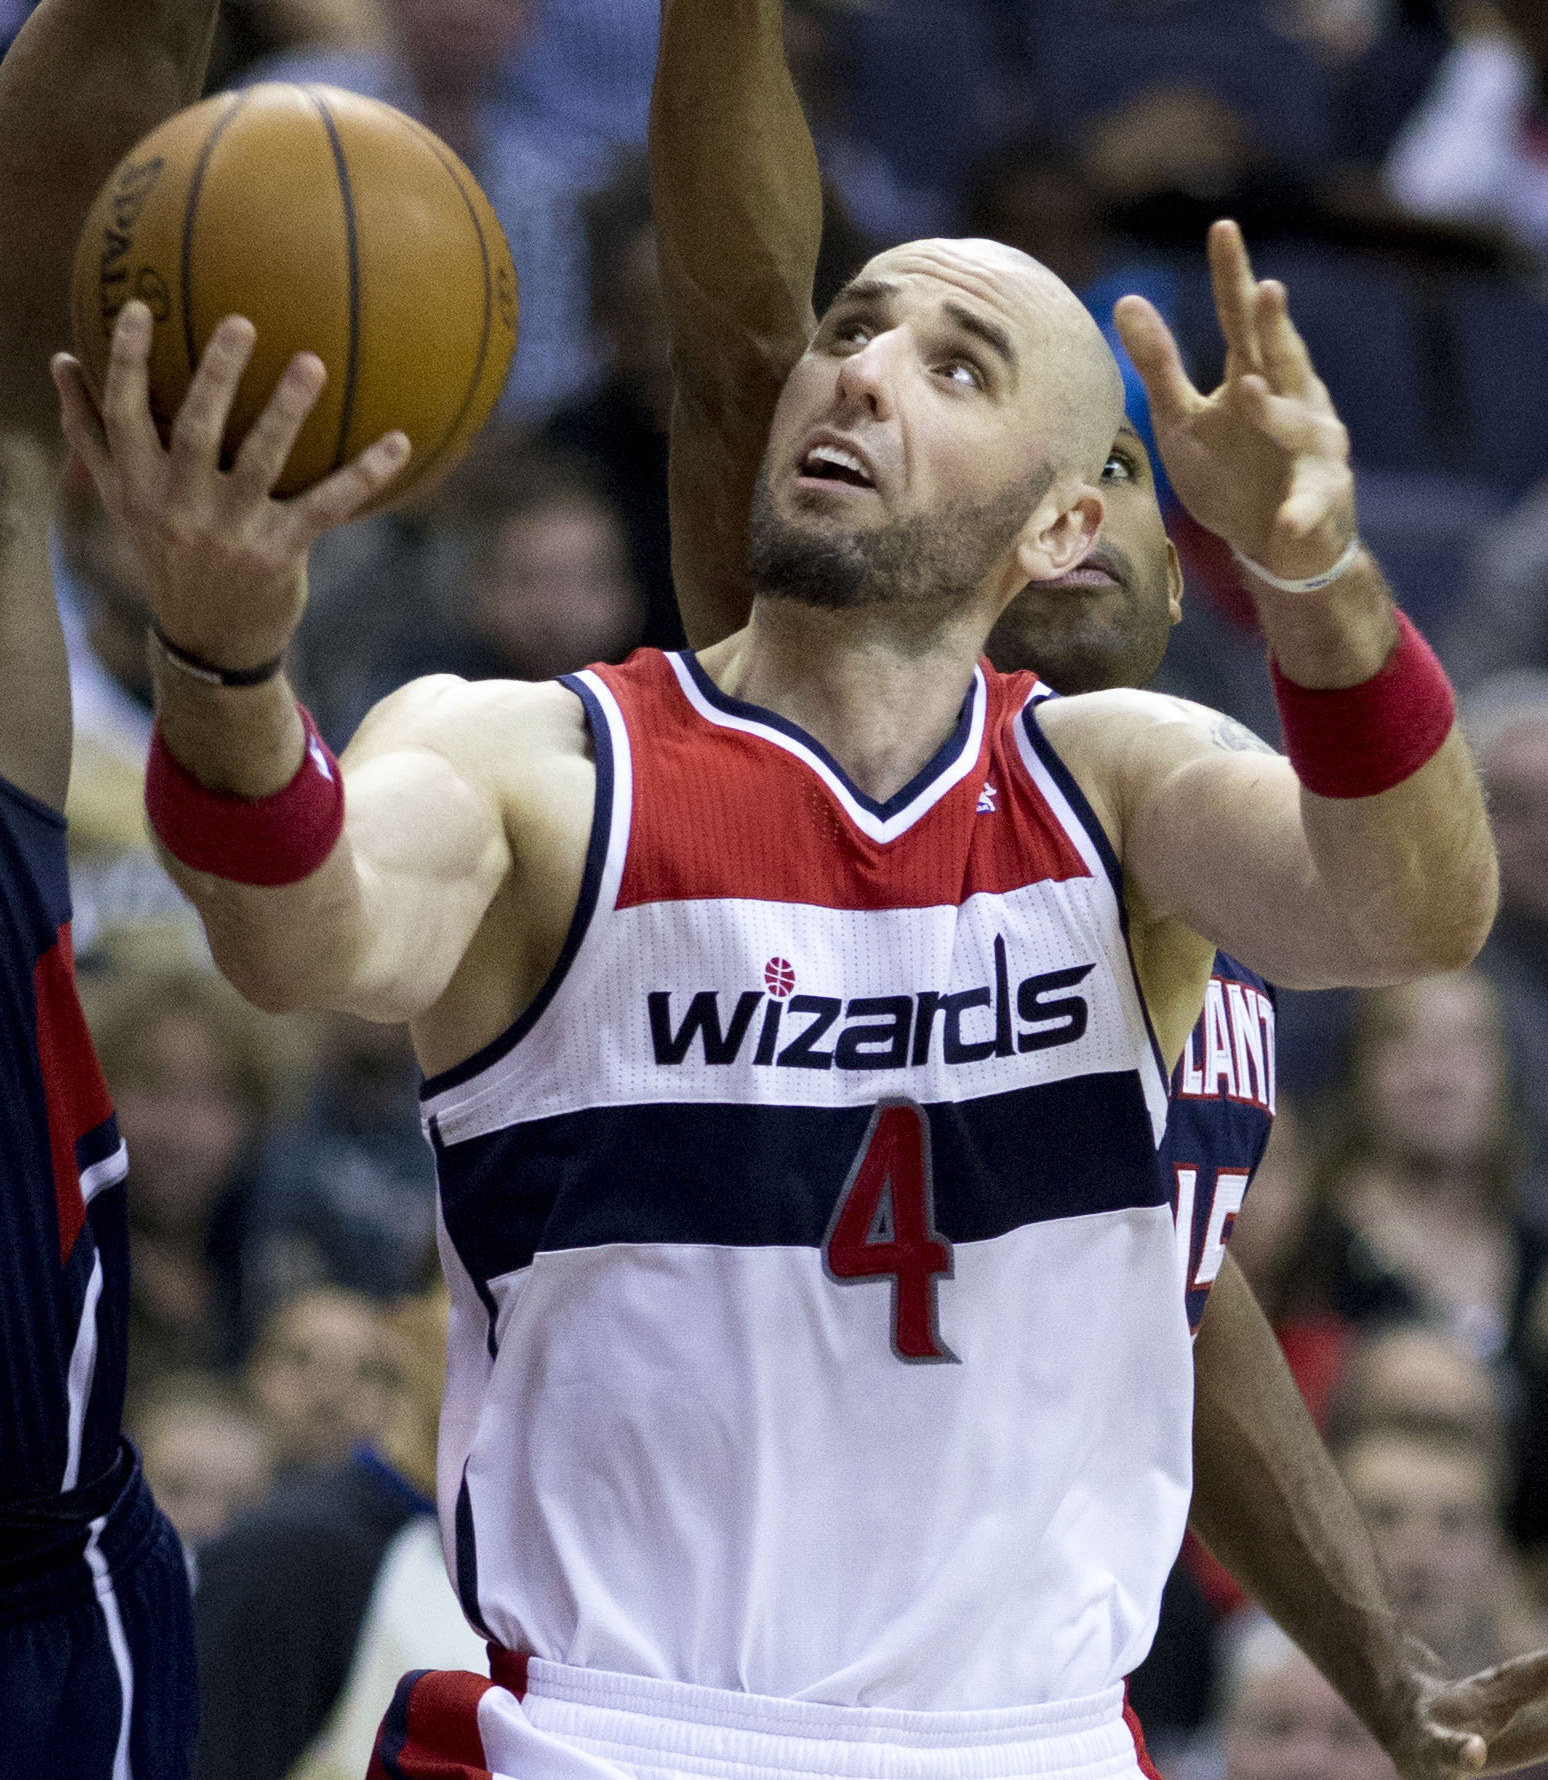
Before I get to this week’s stat update, I wanted to address a recurring sentiment I’ve been hearing from an array of Wizards fans. Basically, it’s some variation on the theme that Kevin Seraphin is having a good season or a breakout game or a coming out party or developing into a valuable reserve.
He’s not. At least not so far.
In fact, he’s playing poorly, even compared to his previous performances, which ranked him as the league’s least productive center (per minute) two seasons ago, and the second least productive center last season.
On offense, he’s shooting a good percentage this season, but continues to be a poor passer and a turnover machine. He rates as having very little defensive impact,because of his anemic defensive rebounding and rampant fouling.
The measuring stick on Seraphin is so off that one fan (who later suggested it was the beer talking) tweeted a rave about Seraphin being a revelation on a night the big fella shot 2-7 from the floor.
Here’s Seraphin’s game-by-game PPA scores for this season:
| GMS | MIN | PPA |
| 1 | 7.7 | -202 |
| 2 | 1.9 | -1003 |
| 3 | 22.1 | 184 |
| 4 | 13.9 | -84 |
| 5 | 18.1 | 64 |
| 6 | 19.5 | 139 |
| 7 | 16.7 | -70 |
| 8 | 16.1 | -36 |
| 9 | 10.6 | -36 |
| 10 | 23.4 | 83 |
| 11 | 13.1 | -29 |
In PPA, 100 = average and higher is better. In 11 games, Seraphin has managed an above-average production rate twice. He’s been a net negative seven times — six, if you prefer to throw out the two-minute stint in the second game of the season.
I like Seraphin, the person. But, he’s not a good NBA player. He hasn’t become one. He’s showing very few signs of developing into one. The Wizards need to find another option as their backup center.
Below is the Player Production Average (PPA) update. PPA is an overall rating stat I developed that credits players for things they do that help a team win and debits them for things that hurt the cause. PPA is per-minute, pace neutral, accounts for defense, and includes a “degree of difficulty” factor based on the level of competition a player faces while on the floor. In PPA, 100 = average, higher is better and replacement level is 45.
| PLAYER | GMS | MPG | 10-Nov | 18-Nov | PPA |
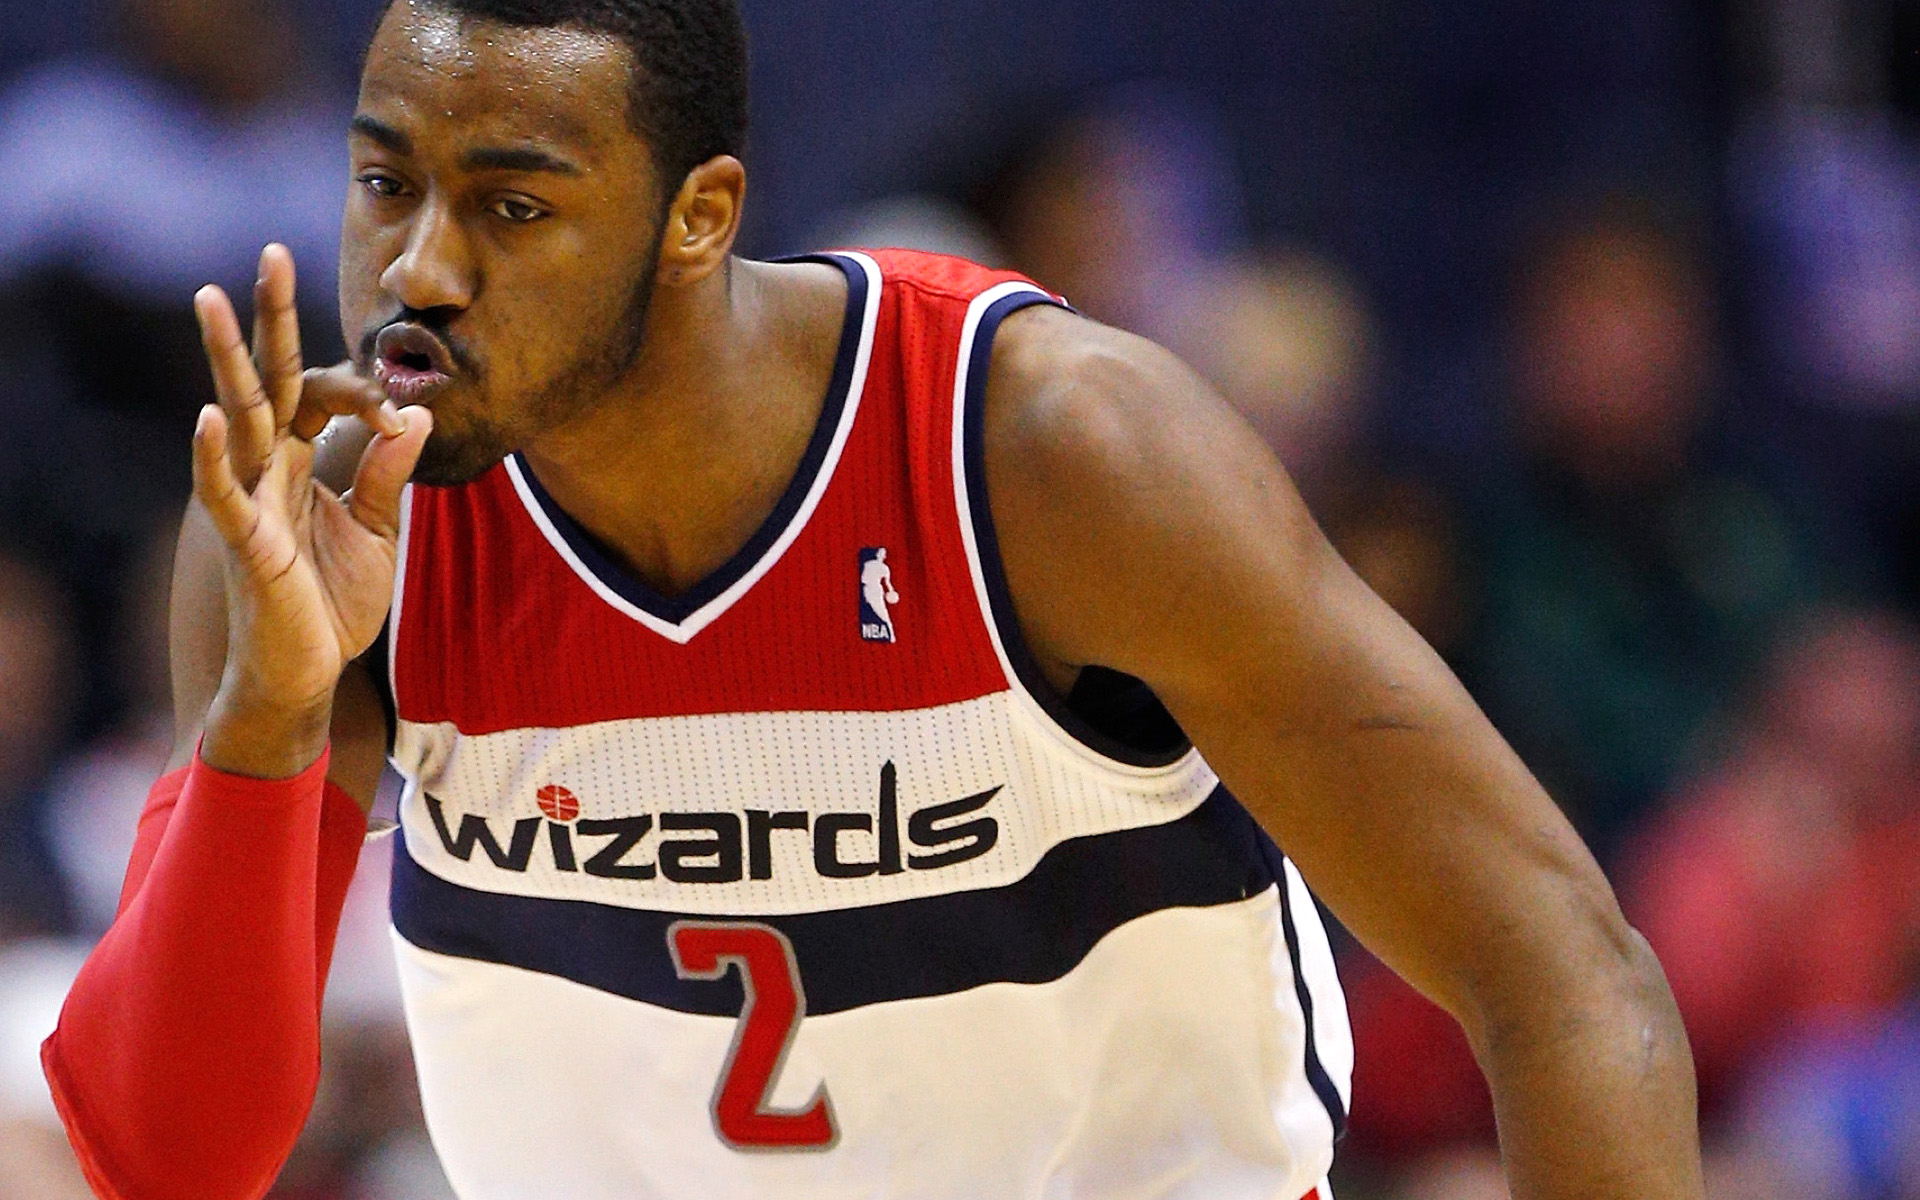
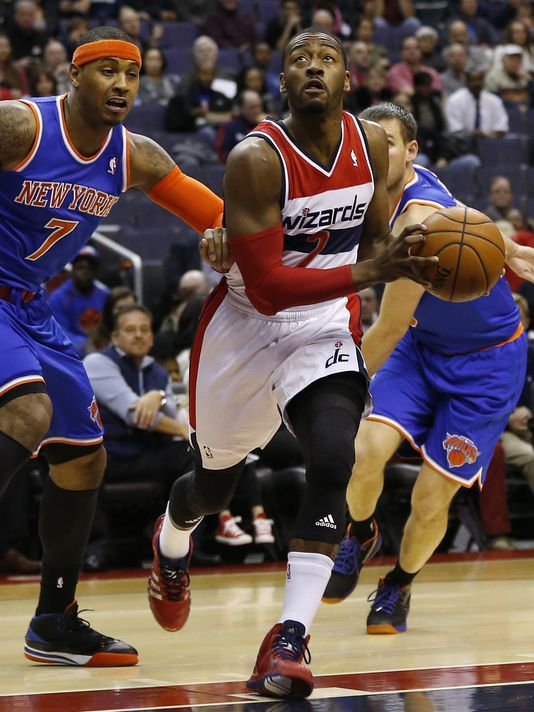
| John Wall | 12 | 35.7 | 185 | 180 | 180 |
| Marcin Gortat | 12 | 30.9 | 181 | 186 | 170 |
| Paul Pierce | 12 | 27.5 | 140 | 138 | 165 |
| Bradley Beal | 3 | 30.7 | 122 | ||
| Rasual Butler | 8 | 16.4 | 60 | 131 | 116 |
| Otto Porter | 11 | 24.4 | 97 | 106 | 101 |
| Garrett Temple | 12 | 26.8 | 121 | 112 | 96 |
| Andre Miller | 12 | 12.6 | 72 | 69 | 92 |
| Kris Humphries | 11 | 15.6 | 46 | 87 | 90 |
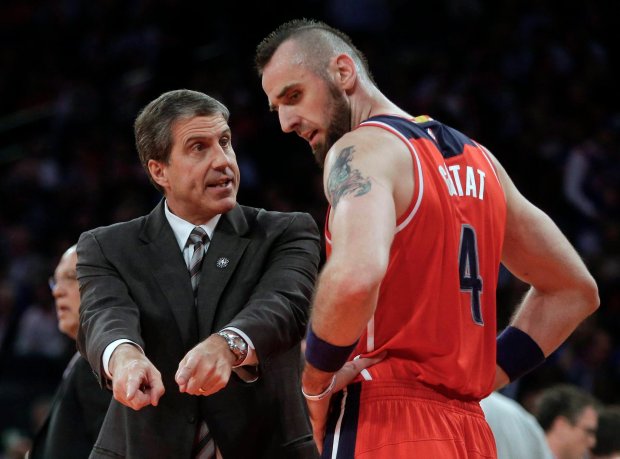
| Nene Hilario | 11 | 27.1 | 108 | 102 | 68 |
| Drew Gooden | 7 | 18.0 | 42 | 40 | 59 |
| Kevin Seraphin | 11 | 14.8 | 38 | 13 | 17 |
| DeJuan Blair | 3 | 3.7 | -41 | -40 | -40 |
| Glen Rice | 5 | 8.6 | -120 | -117 | -117 |
This week, I’ve added a column to show each of the previous PPA updates. I’ll keep doing that as long as there’s space.
Wall seems to be settling in at a very high performance level. It’s scary to think there’s still lots of room for improvement too. Seth Partnow at BBall Breakdown did a nice job of summarizing the problem with Wall’s shot selection. Improved decision-making would likely improve the PG’s individual efficiency, and give his team a much-needed boost.
I don’t see how the Wizards could have hoped for more from Pierce, who is performing at a high level in the early going this season.
Nenê suffered a plantar fascia injury to his right foot in the win over Milwaukee. While it’s not good to lose a starter, Nenê has been playing nothing like a starter. His defense shows up as a slight net positive, but doesn’t come close to offsetting his awful offensive efficiency.