As Dean Oliver first wrote, there are four key factors that determine who wins and loses in the NBA. In order of importance: shooting, rebounding, getting to the free throw line and turnovers. So far this season, the data suggests that variation in efg differential accounts for about 44% of variation in scoring differential; rebounding accounts for 26%, getting to the free throw line about 18%, and turnovers about 11%.
How are the Wizards doing? They’re 25th in efg differential, 24th in rebounding differential, 9th in turnover differential and 10th in free throw differential. All that combines to rank 23rd in average scoring margin, which means they haven’t played even as well as their 19th ranked winning percentage might suggest.
At this point, Basketball-Reference forecasts the Wizards to win about 36 games and indicates the team’s odds of winning the draft lottery (2.5%) are about the same as them making the playoffs this season (2.4%).
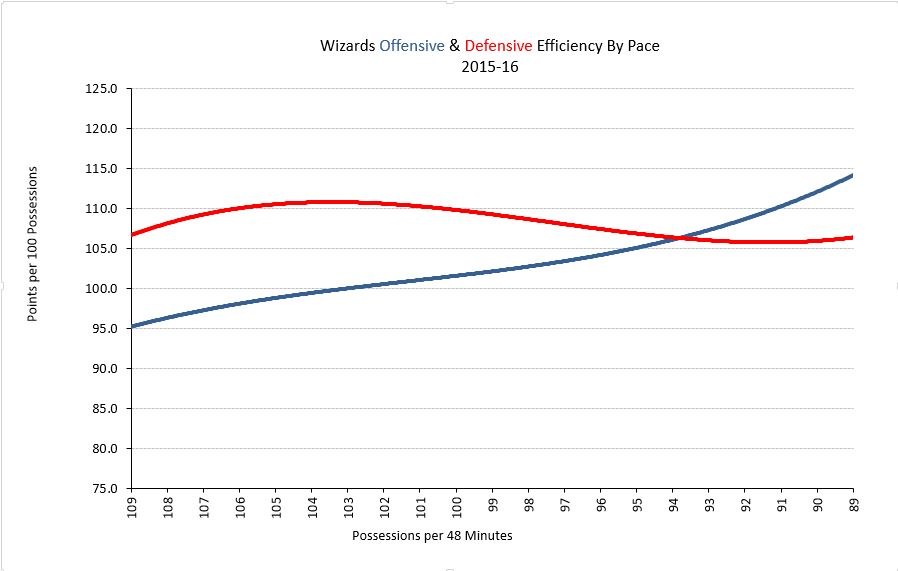
While the team embarked on an effort to play faster, the results through 25 games indicates they may still benefit by slowing down. The defense appears to be largely unaffected by pace, but the numbers suggest the team may be a bit more efficient in slower-paced games. The effect is small, but at this point the team needs every advantage it can get.
Player Production Average
The ratings below are a metric I developed called Player Production Average (PPA). In PPA, players are credited for things they do that help a team win, and debited for things that don’t, each in proportion to what causes teams to win and lose. PPA is pace neutral, accounts for defense, and includes an adjustment based on the level of competition faced when a player is on the floor. In PPA, average is 100, higher is better, and replacement level is 45.
League-wide PPA scores through games played 12/20/15 are here.
PLAYER
GAMES
MPG
11/10
11/22
12/3
12/13
PPA
John Wall
25
35.1
153
129
136
168
157
Marcin Gortat
22
30.2
91
112
128
133
132
Otto Porter
24
32.3
144
158
104
116
107
Jared Dudley
24
26.9
36
92
90
85
98
Ramon Sessions
25
19.7
131
119
84
90
87
Bradley Beal
17
36.5
128
108
96
87
87
Nene Hilario
12
17.4
58
90
80
74
79
Gary Neal
23
22.4
23
49
64
75
78
Kris Humphries
20
18.1
90
121
95
80
78
Garrett Temple
23
18.0
38
106
57
54
70
Ryan Hollins
5
9.6
-40
60
59
Drew Gooden
6
12.8
99
51
57
56
56
Kelly Oubre
18
9.3
-103
-4
-40
-44
9
DeJuan Blair
14
9.5
-345
-129
-112
-45
-34
As I’ve been writing seemingly for years now, the Wizards continue to lack elite production. Click over to the full league numbers and you’ll find 11 players with at least 500 minutes who have a PPA of at least 200. Wall ranks 10th among point guards, but in a virtual tie with Reggie Jackson and Rajon Rondo.
This isn’t Wall’s “fault” exactly, he’s a very good player. But he needs more help than he’s getting. Beal ranks 24th among shooting guards, Porter 16th among small forwards, Gortat 18th among centers, and Dudley 31st among power forwards.
As if the 2015-16 Wizards season wasn’t crummy enough, the team released news over the weekend that Bradley Beal would miss at least a couple weeks with yet another stress reaction in his leg. While this was a bummer of a development — especially when combined with Beal’s fourth consecutive season of pedestrian production — I’m writing today not to induce depression, but to give hope.
Wizards point guard John Wall began the season well: after a strong performance against the Spurs, Wall’s PPA (see below) sat at a heady 184 — not an MVP candidate, but probably in the conversation for All-NBA, and definitely All-Star level.
And then, for some reason (possibly a previously undisclosed ankle injury) his production tanked. After four consecutive good-to-great games to start the year, eight of his next ten games rated below average in PPA. In two of the games (at Boston and home against Toronto), Wall rated a net negative; a scary place for the team’s star. After posting a -70 vs. the Raptors, Wall’s PPA for the season stood at a slightly below average 96.
And then…the calendar switched to December and Wall abruptly began playing like an MVP candidate. In the eight games since that -70, Wall has produced a PPA of 300 or better four times, and another three better than 200. His lone dud was a 74 against Phoenix.
Wall’s PPA for October and November was 96. In December: 278. For context, here are the top five full-season PPA scores on record:
Lebron James, MIA, 2012-13 — 282
Stephen Curry, GSW, 2014-15 — 277
Lebron James, CLE, 2008-09 — 275
Michael Jordan, CHI, 1990-91 — 268
Lebron James, CLE, 2009-10 — 267
Now, even posting a 278 the rest of the way won’t get Wall into this year’s MVP conversation because Curry’s PPA is another 70 points better, but still. Wall has been playing great the past couple weeks, and seems to be turning his season around. That’s a genuine reason for optimism.
Player Production Average
The ratings below are a metric I developed called Player Production Average (PPA). In PPA, players are credited for things they do that help a team win, and debited for things that don’t, each in proportion to what causes teams to win and lose. PPA is pace neutral, accounts for defense, and includes an adjustment based on the level of competition faced when a player is on the floor. In PPA, average is 100, higher is better, and replacement level is 45.
League-wide PPA scores through games played 12/03/15 are here.
PLAYER
GAMES
MPG
11/10
11/22
12/3
PPA
John Wall
22
35.0
153
129
136
168
Marcin Gortat
19
29.6
91
112
128
133
Otto Porter
22
33.0
144
158
104
116
Ramon Sessions
22
19.0
131
119
84
90
Bradley Beal
17
36.5
128
108
96
87
Jared Dudley
21
26.5
36
92
90
85
Kris Humphries
17
17.6
90
121
95
80
Gary Neal
20
22.0
23
49
64
75
Nene Hilario
12
17.4
58
90
80
74
Ryan Hollins
5
9.6
-40
60
Drew Gooden
6
12.8
99
51
57
56
Garrett Temple
20
17.6
38
106
57
54
Kelly Oubre
15
6.9
-103
-4
-40
-44
DeJuan Blair
12
8.5
-345
-129
-112
-45
If I could have one Christmas present for the Wizards, it’d be a starting quality power forward.
Good thing for the Wizards that the NBA season is long because if it ended today, they’d be out of the playoffs and looking at a 2.8% chance of getting Ben Simmons in the 2016 draft.
Washington is just 7-9 with a scoring differential (weighted for strength of schedule) that ranks 23rd — more than a point per game below 22nd ranked Sacramento. This isn’t what fans (or many analysts) expected after the team escaped the first round of the playoffs each of the past two seasons. Washington was supposed to be an Eastern Conference contender, an echelon below Cleveland, but still a force to be reckoned with.
Not so much.
Leaving aside the issue of whether those expectations were realistic, what’s wrong? Lots. As Dean Oliver wrote, there are four key factors that determine winning and losing in basketball: shooting from the floor (efg), turnovers, rebounding, and free throws. Shooting is the most important of these, and the Wizards are tied for 18th in shooting from the floor. They’re second worst at controlling the ball. They’re 27th in offensive rebounding. They get to the free throw line frequently (sixth best), but overall they rank 28th thus far in offensive efficiency.
The situation isn’t much better on defense. They’re 22nd in defensive efg, average in defensive rebounding, and do a good job of forcing turnovers and keeping opponents off the free throw line. But, making the other team miss is the decisive factor: they rank 20th in defense.
Who’s at fault? Everyone, really.
The front office assembled a roster without a starter-quality power forward. While they made a good trade for Jared Dudley (solid player in exchange for nothing), he’s a small forward they’re asking to masquerade as a stretch four. He can get by in the S4 role off the bench, but his lack of rebounding (low career numbers even for a SF), size and athleticism gets exposed against starters. Kris Humphries is a backup; Drew Gooden a bench-warmer; Nenê is aging and injured.
The team obviously established a goal of preserving cap space for free agents in 2016, but wasted short-term signings on Gary Neal, Alan Anderson and Ryan Hollins.
So, put “front office” at the top of the “at fault” list — even without diving down the rabbit hole of botched draft picks and free agent acquisitions in previous years.
Next up: the coaching staff. This season, the team’s braintrust decided to enter basketball modernity by cutting back on two-point jump shots and taking more threes. This shift should have helped the offense run more efficiently even with the team shooting slightly worse from three-point range, but Randy Wittman and company confounded the issue by coupling changed shot selection with playing faster.
The problem: playing faster has nothing to do with playing better. Smart coaching emphasizes strategies that improve efficiency. Swapping two-point jumpers for threes, at-rim attempts and free throws is smart. Playing faster because it’s fashionable is not. (Especially when analysis of the team the past few years suggests the Wizards may have been better in slower-paced games.)
There’s room on the “blame bus” for the players, and rightfully so — virtually everyone who wears the Wizards uniform is under-performing. The only players with a PPA (see below) higher than last year are Otto Porter and Gary Neal, and Porter’s production has cratered since a promising start.
Despite back-to-back outstanding games (vs. Cleveland and the Lakers), John Wall’s PPA is 15 points lower than last season. Marcin Gortat’s production is down 42 points. Bradley Beal is “about the same” (down three points in PPA), but now in his fourth season still rates just average.
Kris Humphries, Jared Dudley, Ramon Sessions, Nenê, Drew Gooden, and Garrett Temple are all performing worse so far this season. All are showing double-digit drops in PPA.
For crissake, even DeJuan Blair, coming off the worst season of his career, is performing worse.
While they don’t belong on the “blame bus,” the Eastern Conference gets some credit for Washington’s poor start. Last season, a stat goober whose name I can’t remember (please take/give credit where it’s due if you read this and know who I’m talking about) estimated that top five teams in the East gained about three wins in 2014-15 because of the sorry state of the conference. This year, several Eastern teams improved while the Wizards attempted to be about the same.
How can the Wizards get better?
De-emphasize pace. Stop worrying about trying to be like Golden State, and play at a pace that makes sense for the roster currently in place. Change the emphasis to valuing possessions and getting good shots, and look for offensive efficiency to rise.
Get Wall and Gortat back to normal. Both are established veterans with production levels significantly better than what they’ve done thus far. It’s hard to believe they’re going to continue playing this poorly.
Get improvement from Beal and/or Porter. Unfortunately, Beal continues to show improvement. He’s much the same player (in terms of overall impact) as he was in his rookie year. Porter started the season well, but has struggled since as teams developed a scouting report. Now it’s time for Porter to come up with ways to produce anyway.
Make a trade. They don’t have a starter-quality PF on the roster.
The season is still young and the Wizards are probably going to start playing better. But, that’s what the Nationals kept saying, and then they ran out of games and the story of their 2015 season was they just weren’t good enough. For the Wizards, there’s an added concern because they need to be good enough to persuade a prominent free agent to join the young core.
Player Production Average
The ratings below are a metric I developed called Player Production Average (PPA). In PPA, players are credited for things they do that help a team win, and debited for things that don’t, each in proportion to what causes teams to win and lose. PPA is pace neutral, accounts for defense, and includes an adjustment based on the level of competition faced when a player is on the floor. In PPA, average is 100, higher is better, and replacement level is 45.
League-wide PPA scores through games played 12/03/15 are here.
I have to say I’m pretty torn on the Wizards so far. On one hand, they’re 6-4 despite injuries to Bradley Beal, Alan Anderson and Martell Webster, as well as growing pains as they figure out how their personnel can mesh with their new Pace & Space offense.
Sticking with the positives: Otto Porter is having a terrific season (leads the team in PPA — see below), and they’re getting some decent play Ramon Sessions, Nenê and Jared Dudley off the bench.
On the other hand…John Wall — despite his publicly stated desire to be an MVP candidate this season — is performing like a pretty average starter, the team seems to crumble whenever Kris Humphries is on the floor (despite decent production from Humphries), and Marcin Gortat is lost on offense.
Since I believe Wall and Gortat will perform more like they did last season, my biggest area of concern is at power forward. Humphries continues to be fairly productive, and has even added a three-point shot. So far this season, he’s at .412. An analysis I did in July suggested .365 could be anticipated.
The problem: the Wizards collapse when he’s out there. So far, Washington is 5.2 points per 100 possessions worse offensively and 5.9 points per 100 possessions worse defensively (net -11.1 points per 100 possessions) when Humphries is out there. While the results are a bit extreme because of the small sample size, keep in mind the Wizards were worse on both ends of the floor with Humphries last season, and Boston was worse on offense with him out there.
My theory: Humphries plays like my iPhone 4 trying to load an app. When it’s time for business (like catching a pass), there’s a pause, then a blank screen, then a spinning wheel, and then maybe some action. It could be that Humphries is just better against reserves than starters.
Unfortunately, the Wizards don’t really have a viable option to start at power forward. Nenê can’t be relied on in that role, and moving him into the starting lineup leaves the team without a reserve center. I’m dubious about Jared Dudley as a viable option — he’s been a below-average rebounder for a SMALL forward throughout his career. (It’s worth mentioning that in the tiny sample size recorded thus far, Dudley is rebounding at his best rate since his rookie year.)
If the team can’t figure out how to play with Humphries as a starter, they may be forced to start Dudley and take some lumps on the board.
Player Production Average
The ratings below are a metric I developed called Player Production Average (PPA). In PPA, players are credited for things they do that help a team win, and debited for things that don’t, each in proportion to what causes teams to win and lose. PPA is pace neutral, accounts for defense, and includes an adjustment based on the level of competition faced when a player is on the floor. In PPA, average is 100, higher is better, and replacement level is 45.
League-wide PPA scores through games played 11/22/15 are here.
The Washington Wizards have embarked on a major renovation of their offense, and while the results are decidedly mixed through their first six games, the right thing is to stay the course and see if players can grow into new roles.
Last season, the Wizards were 18th in pace and 28th in three-point attempt rate (the percentage of field goal attempts from three-point range). So far in 2015-16, they’re second in pace (a whopping 8.4 possessions per 48 minutes faster) and 12th in three-point attempt rate.
The positives so far: decent shooting and an uptick in trips to the free throw line. The negatives: the league’s worst turnover rate, a drop-off in rebounding effectiveness, and an elevated opponent shooting percentage.
While patience is warranted as the team figures out how to operate in the new system, the emphasis on playing at a fast pace continues to be a concern for me. Why? Because pace of play has nothing to do with what causes teams to win games. Go through the record of games and seasons, and you’ll find good (and bad) teams that played fast, slow and in-between. What makes sense is for a team to play at a pace where it’s comfortable, where the players are under control, and where it can get good shots and maximize efficiency. If that’s fast, then play fast. If it’s slower, then slow down.
At the risk of oversimplifying, basketball is a game where teams take turns with the ball until the clock runs out. The number of possessions are about the same for each team over the course of a game — sometimes there’s a possession or two variance based on end-of-period exchanges. Playing fast doesn’t get a team extra possessions because no matter how quick they shoot the ball, the other team gets it back. What matters is efficiency — generating more points on your possessions than the other guy does on his.
The emphasis on playing fast — at least as it’s been implemented by the Wizards so far — seems misguided to me. Pushing the ball up the floor every possession is a good strategy because it can stress the defense, catch defenders out of position, and give Washington more time to run its half court offense. But if rushing leads to more turnovers, and weakened defensive rebounding, the strategy is missing the point.
What really concerns me about the “play fast” mantra is the question of whether the Wizards truly have a grasp on what’s important for a team to win. There’s a palpable feeling that they’re mimicking Golden State without a true understanding of why that style of play works for the Warriors, and how it fits Washington’s personnel. What wins games in the NBA? Doing these things better than the opponent (in order of importance): shooting from the floor, controlling turnovers, getting to the free throw line, and rebounding. Pace ain’t on the list.
Player Production Average
The ratings below are a metric I developed called Player Production Average (PPA). In PPA, players are credited for things they do that help a team win, and debited for things that don’t, each in proportion to what causes teams to win and lose. PPA is pace neutral, accounts for defense, and includes an adjustment based on the level of competition faced when a player is on the floor. In PPA, average is 100, higher is better, and replacement level is 45.
PLAYER
GAMES
MPG
PPA
John Wall
6
34.8
153
Otto Porter
6
34.0
144
Ramon Sessions
6
17.2
131
Bradley Beal
6
34.7
128
Drew Gooden
4
15.0
99
Marcin Gortat
6
28.0
91
Kris Humphries
6
20.5
90
Nene Hilario
6
18.0
58
Garrett Temple
4
3.5
38
Jared Dudley
5
21.6
36
Gary Neal
6
17.7
23
Kelly Oubre
3
5.3
-103
DeJuan Blair
2
6.0
-345
In many ways, I find these numbers (drawn from a small sample size) encouraging. The team’s most productive players so far are its youthful trio of high draft picks: John Wall, Otto Porter, and Bradley Beal.
It’s hard to believe veterans like Marcin Gortat and Jared Dudley will continue playing this poorly. Look for Nenê’s production to improve some as well.
On the other hand, don’t expect big jumps in productivity from DeJuan Blair (who apparently has forgotten how to play basketball), Gary Neal and Garrett Temple.
Also, much as I hate to write it, I think Porter’s PPA is ripe for a drop-off. It’s not likely he’ll continue to shoot 70% from two-point range or have a 60-plus percent efg.
As a sorta codicil to my Wizards preview at Vice Sports, here’s some background on why the Wizards new “pace & space” offense may not provide as much of a boost to the record as those of us pushing for it might have hoped. And no, this has nothing to do with the house-building performance in the opener at Orlando.
Last season, the Wizards took lots of what Randy Wittman called “good shots.” Wittman’s “good” shots were what us analysts called “the worst shots in the game.” In other words: two-point jumpers. As chronicled in many places around the Internets, the best shots are at-rim, threes, and free throws.
How much better could Washington’s offense have been last season? As economist (and creator of the Wins Produced metric) David Berri might write, with a bit of math I estimated they could have added as much as 1.5 points per 100 possessions merely by having league average shot selection. That may not sound like much, but it translates to 3-4 wins, assuming their defense was the same. In other words, 49-50 wins instead of 46.
So, why am I projecting 42 wins this year instead of 45 or 46? The issue is RELATIVE advantage. Many teams around the league are going to variations of the pace and space. Many teams want to play faster and change their shot mix to emphasize at-rim and three-point attempts.
Improvement from the Wizards offense may be counter-balanced by efficiency improvements in the offenses of other teams, and by the emergence of better defensive strategies as more teams adopt similar offensive playing styles. While the Wizards may be more efficient, other team are likely to be more efficient too — at least until defenses start figuring things out. At which point games will come down to overall talent, execution and as yet undetermined strategic innovations.
Your mileage may vary, but I don’t have much faith in Randy Wittman and his coaching staff to lead the next innovation. That means we’re back to base talent, and the Wizards are about middle of the pack in that area. At least until they sign Kevin Durant next summer.
A few years back, I embarked on an effort to develop a statistically-based, objective method of evaluating prospects for the NBA draft. I make no claims that it’s perfect, but I’ve found the results decent enough, albeit not yet subjected to rigorous analysis. That’s coming.
When I get time.
Someday.
On the Wizards message board at RealGM, I referred to the effort a few times as “Ye Olde Draft Analyzer,” someone called it YODA, and the name stuck. YODA isn’t complex — at least not yet. It’s built on the Player Production Average metric I devised that credits players for things they do to help their teams win, and debits them for things they do that hurt the cause — each in proper proportion. YODA takes each player’s production (box score stats) then applies adjustments for position, age, team strength/level of competition, and objective measures of physical attributes (combine measurements and times).
In general, YODA likes efficient players who shoot well, rebound well, assist without committing turnovers, and generate blocks and steals without fouling too much. Being on a good team that plays a challenging schedule is also helpful, but not determinant — players like Kenneth Faried, Paul Millsap and Danny Granger had excellent ratings despite not playing for traditional powers.
YODA’s biggest limitation is international players. I haven’t had the time to research the numbers posted by prospects overseas, or to objectively assess the quality of the competition they face. Rather than guessing, I’ve chosen to leave them out of the process for now. Given the global nature of the draft, that’s a significant limitation, and it’s one I hope to fix for next year.
My belief on draft strategy is that the smart move is to pick the best player available, even if he doesn’t fit an immediate need. My approach is to first rate players in absolute terms, then group them into tiers of “about the same.” The idea is that when several players of “about the same” quality are available when your team’s pick comes, the team can pick the player they think best fits current needs. But, don’t reach into a lower tier for a perceived need. Just pick the better player and make another move down the road, if necessary.
Here’s this year’s draft in order of both absolute value according to YODA, and divided by tier.
TIER ONE
Karl-Anthony Towns, PF, Kentucky
Jahlil Okafor, C, Duke
TIER TWO
D’Angelo Russell, PG, Ohio State
Frank Kaminsky, C, Wisconsin
TIER THREE
Rondae Hollis-Jefferson, SF, Arizona
Kelly Oubre, SF, Kansas (EDITED position due to corrected measurements)
Delon Wright, PG, Utah
Cameron Payne, PG, Murray State
Bobby Portis, PF, Arkansas
TIER FOUR
Justise Winslow, SF, Duke
Myles Turner, C, Texas
TIER FIVE
Jerian Grant, PG, Notre Dame
Robert Upshaw, C, Washington
Willie Cauley-Stein, C, Kentucky
Sam Dekker, SF, Wisconsin
Devin Booker, SG, Kentucky
TIER SIX
Kevon Looney, PF, UCLA
Tyus Jones, PG, Duke
Cliff Alexander, PF/C, Kansas
Terry Rozier, G, Louisville
Justin Anderson, SF, Virginia
Stanley Johnson, SF, Arizona
TIER SEVEN
Briante Weber, PG, VCU
Bryce Jones, SG, Iowa State
Aaron White, PF, Iowa
Trey Lyles, PF, Kentucky
Montrezl Harrell, PF, Louisville
TIER EIGHT
Richaun Holmes, PF, Bowling Green
Pat Connaughton, SG, Notre Dame
R.J. Hunter, SG, Georgia State
In simple terms, the first round grades end with Tier Six. If things go more or less the way the mock drafts predict, the Wizards may be able to select a PG from Tier Three (Delon Wright), or perhaps a PF with potential like Looney.
While I fully expect the Wizards to sell or give away their second round pick, I think there may be some opportunities to get potentially useful players on inexpensive contracts with additional second rounders. I’d be interested in taking a guy like Cliff Alexander, or even Robert Upshaw (assuming he’s medically cleared to play despite a heart condition).
The consensus view on this year’s draft seems to be that it’s top heavy with a steep drop-off in talent after the lottery. I don’t really see that in the numbers. Towns and Okafor are a relatively weak top two, and the drop in ratings isn’t any greater than it is in most years. In other words, it looks like a draft.
Feel free to tweet me if you have questions about specific players. I’ve analyzed most seniors, and virtually all of the early entrants (except for the international players).
EDITED on June 30 when I was able to confirm that Kelly Oubre’s standing reach, as measured at the scouting combine, was incorrect. When the measurement was corrected, Oubre moved from Tier Four to Tier Three.
Just numbers because…no time. This is through games played on May 10, 2015.
Player Production Average (PPA) is an overall rating stat I developed that credits players for things they do that help a team win and debits them for things that hurt the cause. PPA is pace neutral, accounts for defense, and includes a “degree of difficulty” factor based on the level of competition a player faces while on the floor. In PPA, 100 = average, higher is better and replacement level is 45.
The Washington Wizards vanquished the Toronto Raptors in the first round of the NBA playoffs thanks to an innovative approach conceived by team president Ernie Grunfeld, funded by owner Ted Leonsis, and implemented by head coach Randy Wittman. Drawing upon unique abilities possessed by point guard John Wall, Wittman and Grunfeld developed a plan that in the days before the playoffs sent Wall and center Marcin Gortat on a (until now) top secret mission to prehistoric times.
“It was just a little time travel,” Wall said, stifling a yawn. “Just doing whatever I can to help my teammates out.”
” ‘Time travel?’ He said that?” Wittman snapped when told of Wall’s comment. “Okay, first of all, it’s not time travel. It’s just a way of using John’s ability to alter the space-time continuum to bridge the interdimensional gap between this reality and another in which conditions very much like our prehistoric era continue to exist.”
According to sources, Wall was essential to executing the project, but Gortat volunteered.
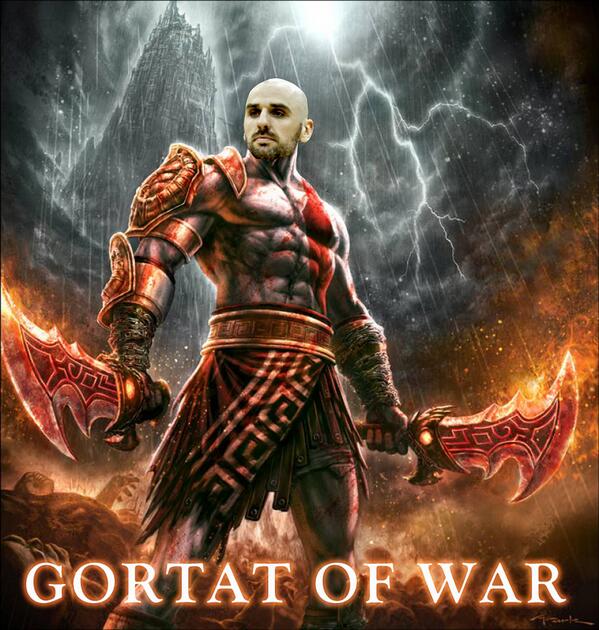
“We were going to play Raptor,” the Polish center said. “This way I could study real raptor, see how it move, see how it fight, see how it love. I fight six velociraptor at same time — hand-to-hand. After that, Toronto Raptor not so tough.”
While Gortat engaged in mortal battle with ferocious dinosaurs from the later Cretaceous Period, Wall did no fighting and did not engage with the ferocious reptiles.
“I’m competitive, but I’m not a fighter,” Wall said. “i just mostly slept.”
While Wall’s account of an extended nap — made necessary, he said, by the rigors of time travel — had its charm, it did not stand up to investigation. In reality, Wall executed the second part of the Grunfeldian Plan, and tracked down a pubescent Paul Pierce.
“Paul’s one of the oldest players in the league, and we were concerned about his physical condition,” said Wizards vice president Tommy Sheppard, speaking on condition of anonymity. “By sending John and March back seventy-one million years, we felt we could get March first-hand experience with some velociraptors and we could do something to help Paul get back to top form. This was definitely a two birds, one stone kind of thing.”
Wall’s mission was to locate the young Pierce and persuade him to provide biological samples, including blood, spinal fluid and stem cells. The samples would then be combined in Wittman’s laboratory, located deep beneath the Verizon Center, into a genetic cocktail that would rejuvenate the aging Pierce.
“Gotta say it didn’t take much convincing,” Wall said when he learned that details of his trip were known. “Once I told him about his later self being on a team in the playoffs, his competitive nature kicked in and he wanted to help. ‘Course I first had to beat him in a game of Micropachycephalosaurus before he’d do it, but basketball hadn’t even been invented back then so I had a little bit of an advantage. It was tough, but…well…you saw what happened in round one. Look man, Pierce ain’t changed a bit.”
Successful execution of the Grunfeldian Plan had several positive effects fans could see. Gortat and Pierce performed spectacularly in round one. And, freed from the rigors of researching and theorizing about interdimensional temporal travel, Wittman was able to refocus his attention on coaching the team.
“I looked at the numbers and said to the guys ‘What the hell is this?’ ” Wittman said. “Why are we taking so many two-point jumpers? What’s wrong with you people? Do I have to think of everything? Attack the hoop and shoot threes.”
The plan nearly backfired, however, when Wall, exhausted from interdimensional travel, searching for the younger version of Pierce, and the epic game of Micropachycephalosaurus, played horribly in game one. Sources with knowledge of the situation said Wall recovered thanks to some remaining bottles of Caron Butler’s “Tuff Juice.”
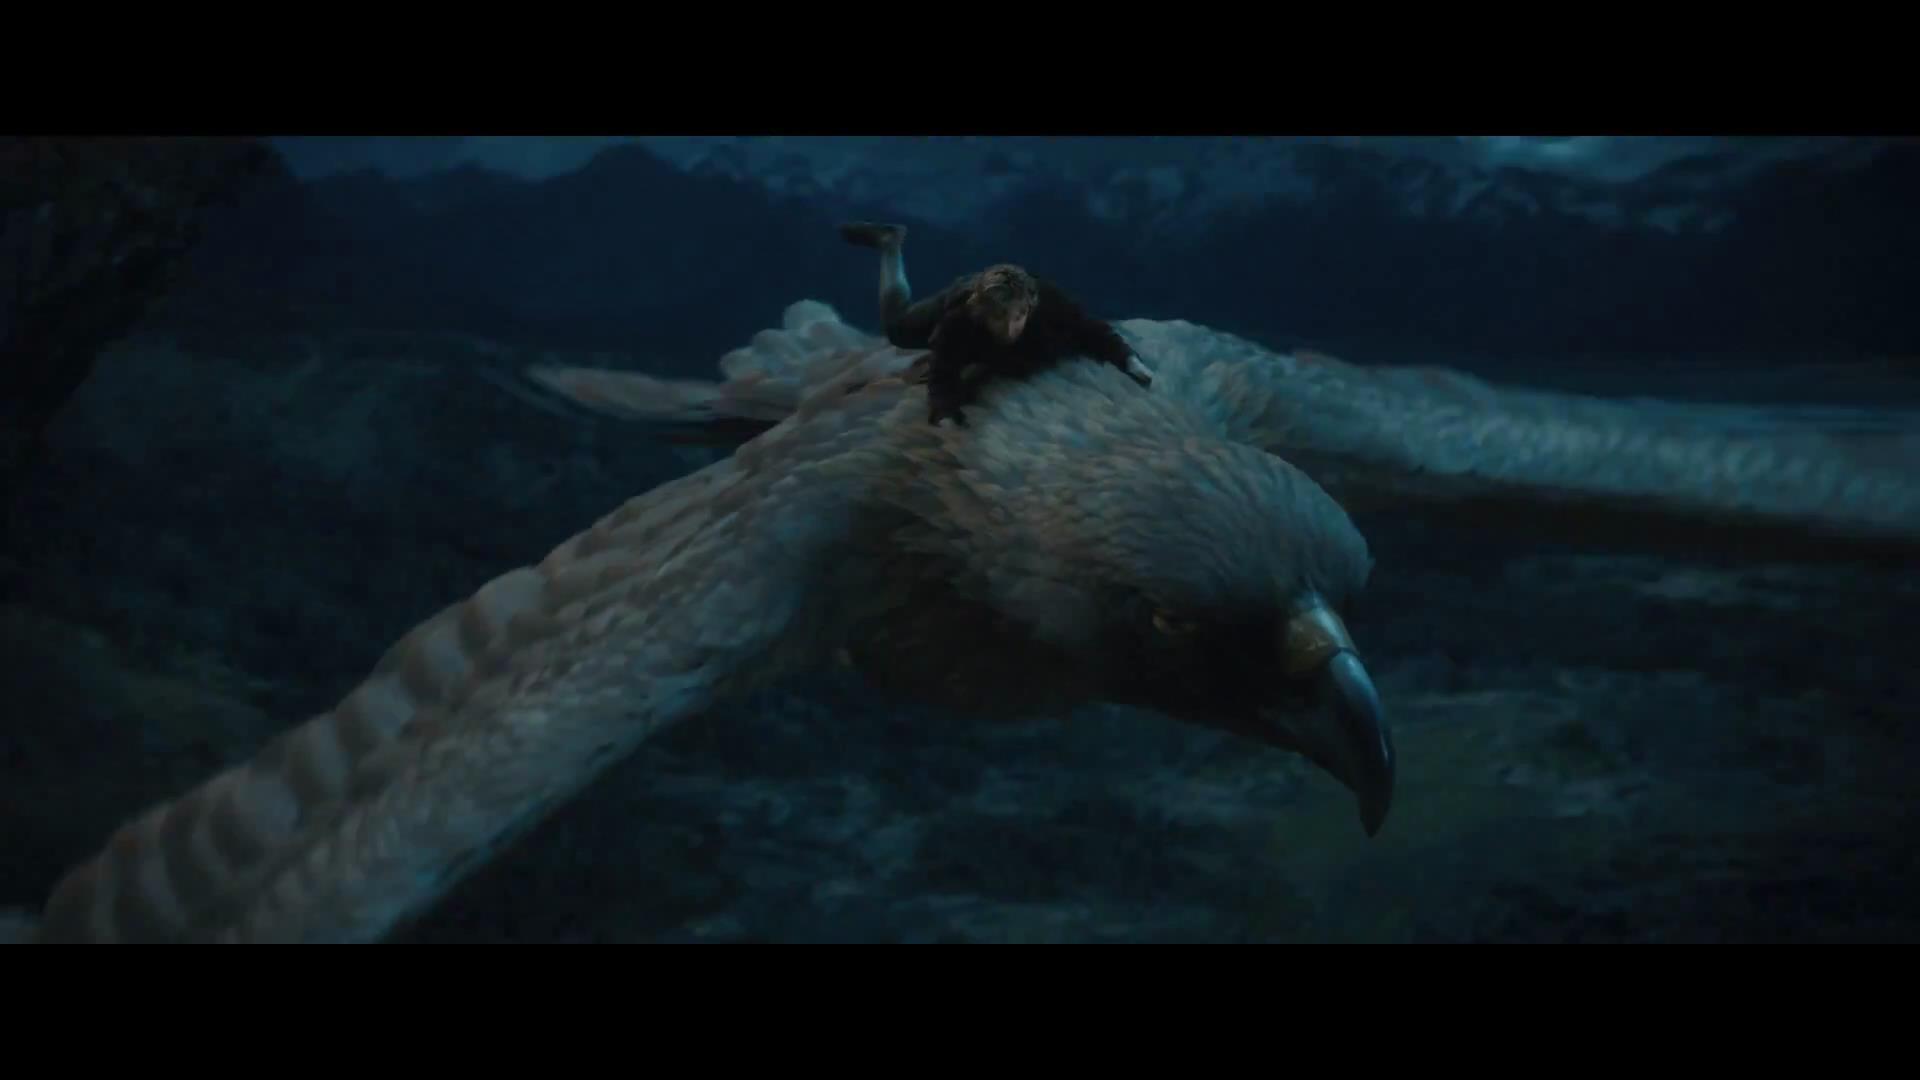
While details remain scarce, preparation for the team’s second round matchup with the Atlanta Hawks involved a journey to Middle Earth where Gortat taught teammates the art of riding the Great Eagles of Manwë. Sources could not corroborate the story with cell phone photos or video by publication time. I was able to obtain this image of a young Marcin Gortat riding one of the Great Eagles in Middle Earth, which Gortat claims is located not far from where he was born in Lodz, Poland.
A young Marcin Gortat riding a Great Eagle of Manwë.
Player Production Average: First Round
Player Production Average (PPA) is an overall rating stat I developed that credits players for things they do that help a team win and debits them for things that hurt the cause. PPA is pace neutral, accounts for defense, and includes a “degree of difficulty” factor based on the level of competition a player faces while on the floor. In PPA, 100 = average, higher is better and replacement level is 45.
WASHINGTON WIZARDS
POS
GMS
MPG
PPA
Marcin Gortat
C
4
31.3
294
Paul Pierce
SF
4
28.5
209
Will Bynum
SG
1
4.0
183
John Wall
PG
4
38.0
165
Otto Porter
SF
4
32.0
147
Kris Humphries
PF
1
5.0
146
Bradley Beal
SG
4
41.8
116
Drew Gooden
PF
4
20.5
107
Nene Hilario
PF
4
24.3
82
Ramon Sessions
PG
4
16.5
67
Kevin Seraphin
C
3
11.0
50
Martell Webster
SF
1
4.0
36
Rasual Butler
SF
2
3.5
-85
TORONTO RAPTORS
POS
GMS
MPG
PPA
Greg Stiemsma
C
1
2.0
535
Jonas Valanciunas
C
4
26.5
142
Patrick Patterson
PF
4
26.5
122
Amir Johnson
PF
4
28.0
91
DeMar DeRozan
SG
4
39.8
75
Terrence Ross
SF
4
26.8
38
Lou Williams
SG
4
25.5
26
Greivis Vasquez
PG
4
25.3
14
Kyle Lowry
PG
4
32.8
-6
Tyler Hansbrough
PF
4
12.0
-13
James Johnson
PF
2
6.0
-118
While the playoffs are the most important part of the NBA season, fans and analysts tend to go overboard in using postseason results to reach new conclusions. The Wizards were impressive in round one, but it’s worth keeping in mind that any given round of the post-season (especially a four-game sweep) is the very definition of Small Sample Size Theater. Bradley Beal led the Wizards with 167 minutes in the first round.
I’d caution against overreaching in using the win over Toronto to make a significant reassessment of the Wizards. They’ll get a tougher test against the Hawks.
That said, the good news from round one was getting good production from the team’s youthful triumvirate. Washington was led by Gortat and Pierce, both of whom were outlandishly efficient, and got outstanding play from Wall and Otto Porter, and solid production from Bradley Beal.
Unsurprisingly (considering Washington’s resounding series win), five Wizards were more productive than the most productive Toronto player. The Raptors were hampered by an extreme lack of production from its backcourt, including a net negative performance from All-Star Kyle Lowry.
Meanwhile, Gortat was the league’s most productive player in the first round, and Pierce’s production ranked eighth.
Okay, I’ve tried several different ways to talk myself into predicting that the Wizards will somehow beat the Toronto Raptors in the first round of the playoffs and meet their doom in a second round matchup with the Atlanta Hawks. Hasn’t worked, though.
I know Toronto struggled over the last couple months of the season. So did the Wizards. I know the Raptors have a not-so-good coach. So do the Wizards. In a way, the two teams are opposing images of the other. Washington has a good defense and a crummy offense; Toronto has a terrific offense and a bad defense. The key difference: Toronto is better.
The gap between the teams isn’t oceanic. Washington’s odds in any one particular contest in the upcoming series aren’t awful. They have basically a 41% chance of winning at Toronto and a slightly better than coin flip odds of winning at home. In terms of probability, it would be something like winning three straight coin flips, and then winning a “loaded” toss where the odds have been lowered from 50-50 to 60-40. It’s possible, but not likely.
The Wizards could be helped a bit by Kyle Lowry’s iffy back, but the numbers accumulated over a six-month season say they’ll be lucky to pull off the upset. On the bright side for fans hoping to at least be entertained, there’s only about a 9% chance the Raptors sweep.
As you can see from the table below, the Wizards are significant underdogs against the Raptors. The only teams with worse odds of winning their first round series are the eight seeds (Brooklyn and New Orleans), and the East’s seven seed (Boston). The best chances for first-round upsets come in the more balanced West. Houston vs. Dallas and the Clippers vs. the Spurs look to tight.
The best chance for a seeding upset is likely to happen in the second round where the Clippers would be favored against either Houston or Dallas.
The numbers suggest that Golden State — the league’s best team all season — has the best chance of winning the championship this season. I actually estimate them with a better than 50% chance of being champions. Despite coasting through the last few weeks of the season, Atlanta finished the regular season as the East’s best team by a significant margin. They’ll be tested in the Eastern Conference Finals against Cleveland and Lebron James.