So far, I’ve used my Statistical Doppelganger Machine to find “most similar” players in NBA history for the following:
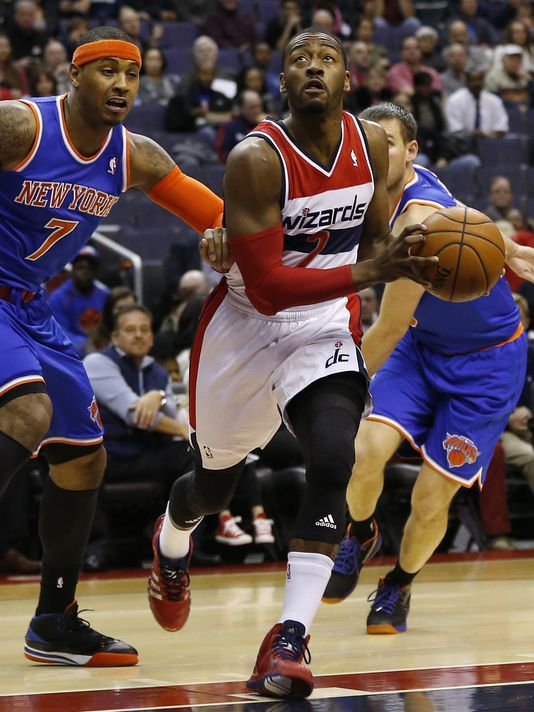
- The young backcourt: John Wall and Bradley Beal,
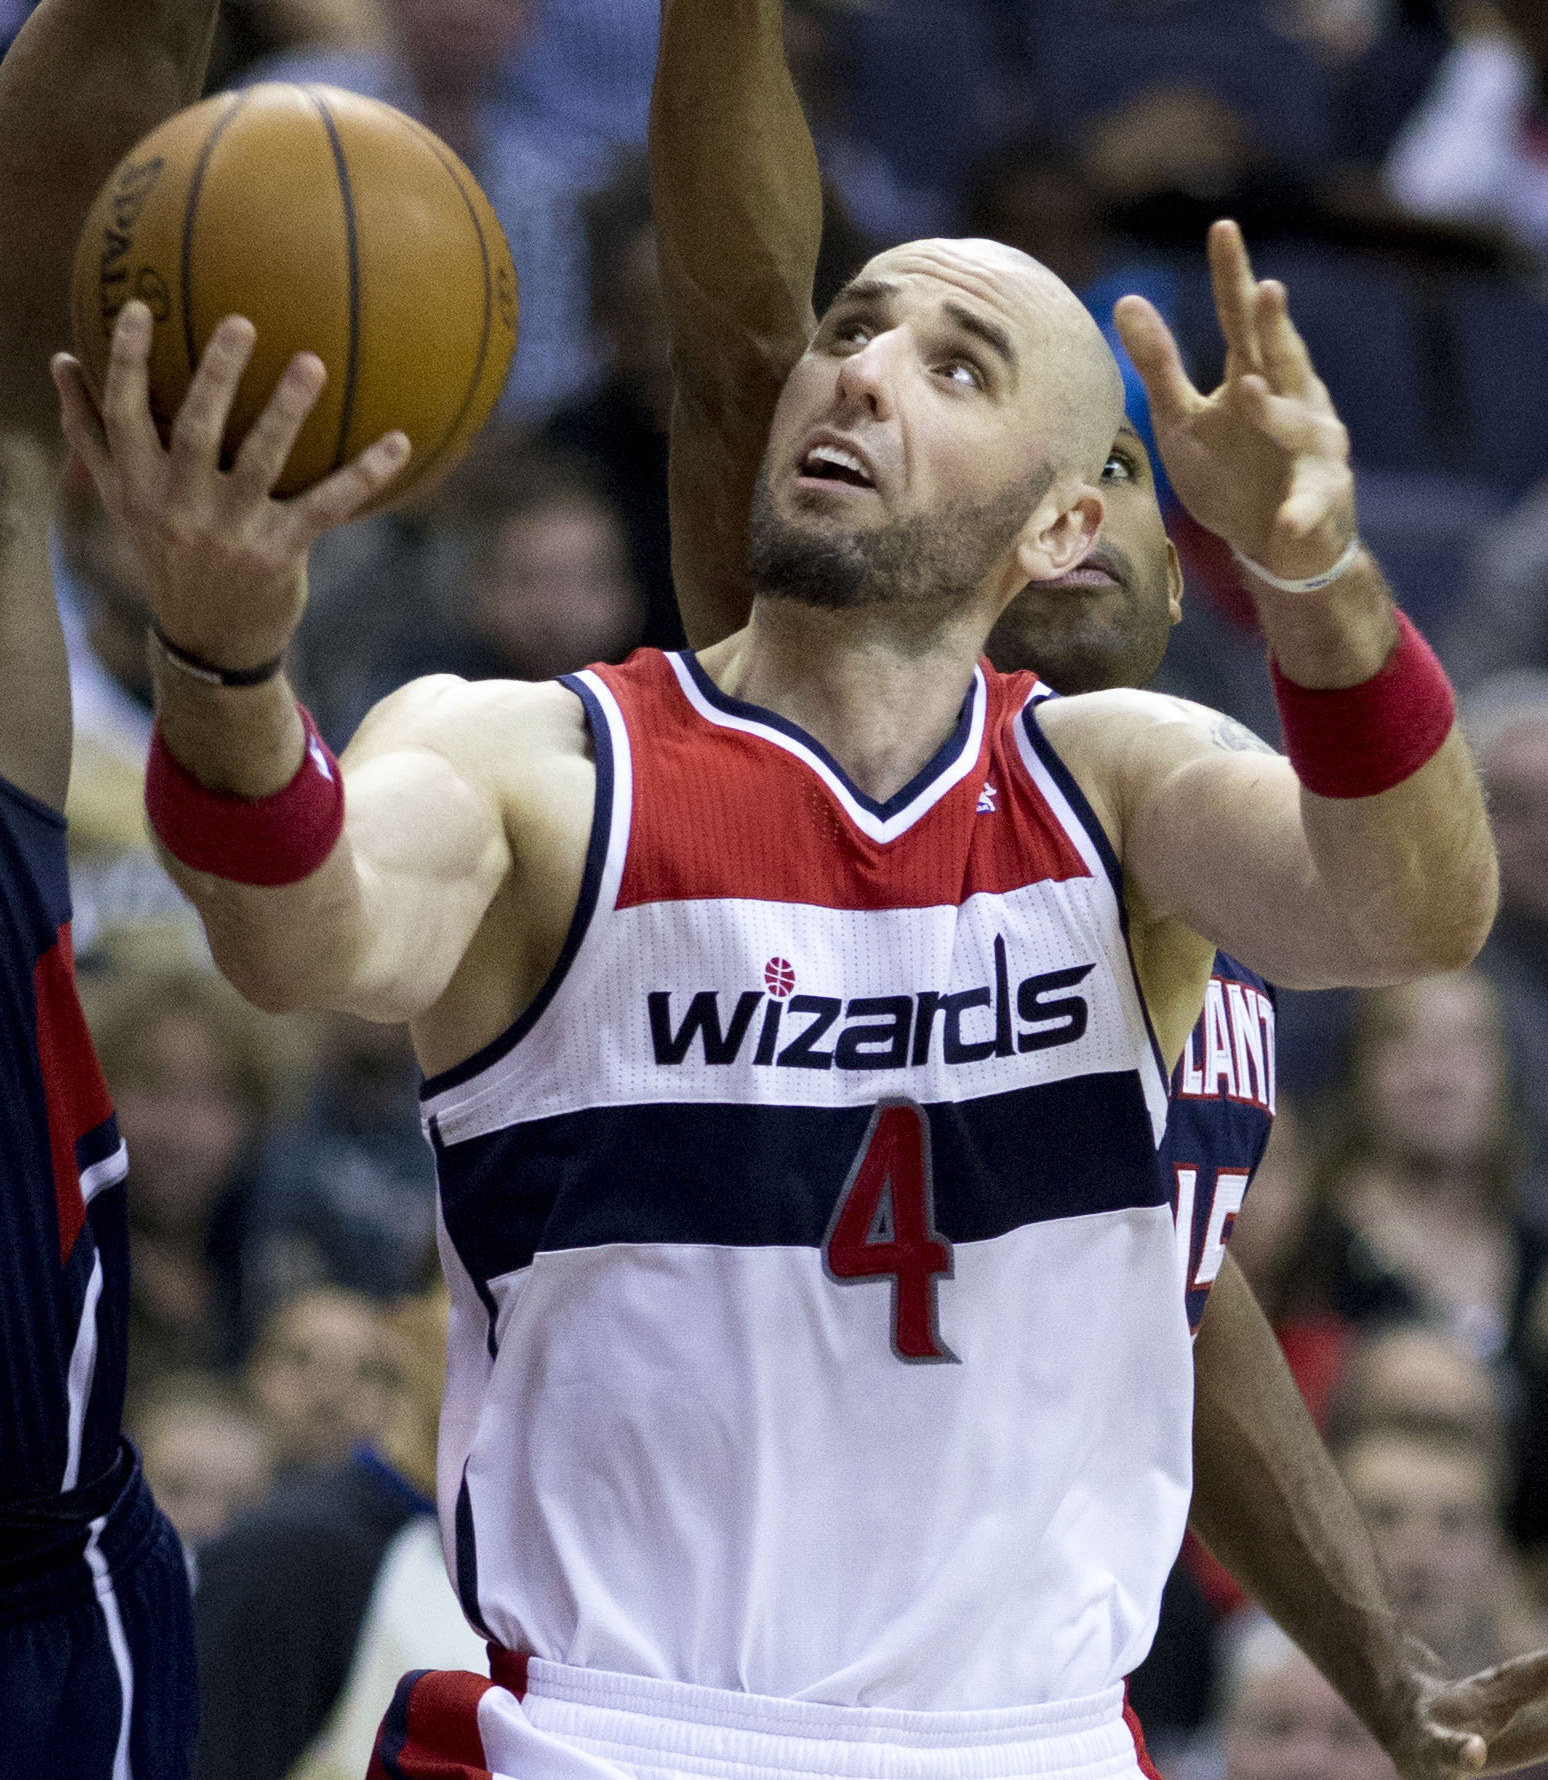
- The Ancients: Nenê, Marcin Gortat, Paul Pierce, Drew Gooden and Rasual Butler, and
- The Enigmas: Otto Porter, Glen Rice Jr., and Garrett Temple.
Next through the machine: Bump (Kris Humphries, DeJuan Blair and Kevin Seraphin), and Bruise (Martell Webster).
For those interested, I discuss the method a bit in the first post. Basically, the Machine looks for most similar production at a similar age.
First up: Humphries.
| PLAYER | POS | SEASON | AGE | TEAM | SIM SCORE | PPA SEASON | PPA PEAK |
| Kris Humphries | PF | 2013-14 | 28 | BOS | 100 | 132 | 146 |
| Chris Wilcox | PF | 2010-11 | 28 | DET | 90 | 121 | 165 |
| Lawrence Funderburke | PF | 1998-99 | 28 | SAC | 89 | 120 | 120 |
| Mark Strickland | F/C | 1997-98 | 27 | MIA | 89 | 111 | 111 |
| Tom Owens | PF/C | 1977-78 | 28 | POR | 89 | 126 | 149 |
| Taj Gibson | PF | 2011-12 | 26 | CHI | 89 | 105 | 105 |
| Antonio McDyess | PF | 2006-07 | 32 | DET | 88 | 115 | 175 |
| Marcus Camby | C | 2002-03 | 28 | DEN | 88 | 131 | 212 |
| Will Perdue | C | 1994-95 | 29 | CHI | 88 | 140 | 140 |
| Loy Vaught | PF | 1992-93 | 24 | LAC | 87 | 99 | 131 |
| Clarence Weatherspoon | PF | 1999-00 | 29 | MIA | 87 | 108 | 168 |
What Humphries did last season generates a nice list of solidly productive role playing bigs, which is about what I’d have expected. The group’s average peak performance is 147 — for Humprhies it’s 146. Average peak age for this group was 26.5 — Humprhies appears to have peaked at 25. I say “appears” because Humphries, of course, is still going.
In the seasons after those shown here, the similars were a mixed bag of ups and downs. As a group, they were steady. This suggests that Humphries may be in the “plateau” portion of his career production arc. (That arc typically follows a trendline of improving production early in a player’s career to a peak between ages 25 and 28, a plateau until the early 30s, and then decline.
| PLAYER | POS | SEASON | AGE | TEAM | SIM SCORE | PPA SEASON | PPA PEAK |
| DeJuan Blair | PF | 2013-14 | 24 | DAL | 100 | 97 | 145 |
| Dennis Rodman* | F | 1986-87 | 25 | DET | 90 | 84 | 180 |
| Craig Smith | PF | 2006-07 | 23 | MIN | 90 | 87 | 91 |
| Matt Geiger | F/C | 1993-94 | 24 | MIA | 89 | 87 | 153 |
| Gary Trent | PF | 2002-03 | 28 | MIN | 88 | 103 | 133 |
| Channing Frye | PF | 2007-08 | 24 | POR | 88 | 77 | 118 |
| Jerome Whitehead | C | 1982-83 | 26 | SDC | 88 | 104 | 128 |
| Alan Henderson | PF | 1996-97 | 24 | ATL | 88 | 67 | 116 |
| Robert Traylor | C | 2003-04 | 26 | NOH | 88 | 79 | 143 |
| Greg Ballard | SF | 1978-79 | 24 | WSB | 88 | 114 | 157 |
| Ivan Johnson | PF | 2011-12 | 27 | ATL | 88 | 73 | 83 |
I very much like seeing Dennis Rodman’s name on the list, although this is the pre-RODMAN Rodman. This was actually Rodman’s rookie season, and while he rebounded well, he wasn’t yet the outlandish board man he’d later become. This Rodman was even willing to shoot the ball now and then — he used roughly 19% of his team’s possessions while on the floor (average is 20%).
The rest is kind of an odd group at first glance. There are physical, burly types like Smith, Trent, Traylor and Johnson, and more finesse types Frye, Henderson and Geiger.
You may be wondering what Frye is doing on this list at all. But, this isn’t the stretch-4 Frye, this is the PF/C type in his second to last year in Portland. He had just 10 three-point attempts that season with the Blazers. Two years later, he’d hoist 392 for the Suns.
The average peak PPA for this group was 132 at age 25.6. Blair’s best season was a 145 as a rookie, but he’s just 25 years old this season. This group of similars was a mix of improvement and decline in the year following the one shown.
| PLAYER | POS | SEASON | AGE | TEAM | SIM SCORE | PPA SEASON | PPA PEAK |
| Kevin Seraphin | C | 2013-14 | 24 | WAS | 100 | 35 | 95 |
| Stanislav Medvedenko | PF | 2002-03 | 23 | LAL | 90 | 17 | 84 |
| Mark Alarie | PF | 1987-88 | 24 | WSB | 88 | 42 | 77 |
| Keith Lee | F/C | 1986-87 | 24 | CLE | 87 | 55 | 77 |
| Bill Martin | SF | 1985-86 | 23 | IND | 86 | 34 | 34 |
| Greg Foster | F/C | 1990-91 | 22 | WSB | 86 | 36 | 42 |
| Malik Allen | PF | 2006-07 | 28 | CHI | 86 | 35 | 76 |
| Channing Frye | PF | 2008-09 | 25 | POR | 86 | 27 | 118 |
| Melvin Turpin | C | 1986-87 | 26 | CLE | 86 | 50 | 130 |
| Josh Powell | PF | 2008-09 | 26 | LAL | 86 | 29 | 61 |
| Brad Lohaus | F/C | 1987-88 | 23 | BOS | 85 | 49 | 93 |
I know there’s a lot of hope that Seraphin may finally have a breakout season. Even before looking at his comps, I’d have recommended betting against that “breakout.” This list only solidifies that recommendation.
To me, Seraphin is a reflection of how brutal the NBA can be. He’s one of the better basketball players in the world — top 600, easy. Maybe top 500. But, he hasn’t been good enough to be a bona fide NBA player.
No matter what slice of time I examine, I keep finding the same problems with Seraphin’s play: too many turnovers, too few rebounds, rampant fouling. That was true, even during his “good” stretch a few years ago when he performed at about the level of an average NBA player. Since then, he’s been awful. The league’s least productive center two years ago. The second least productive center last season.
This group of similars can be characterized as peaking early (age 24.8) and low (average peak PPA: 81). The best of the group was Mel Turpin. That Frye season was his last in Portland, and the worst of his career.
The good news is that most of these players improved the season following the one that appears on the list. The bad news: the average improvement wasn’t much.
| PLAYER | POS | SEASON | AGE | TEAM | SIM SCORE | PPA SEASON | PPA PEAK |
| Martell Webster | SF | 2013-14 | 27 | WAS | 100 | 77 | 114 |
| Keith Bogans | SG | 2007-08 | 27 | ORL | 95 | 81 | 89 |
| Morris Peterson | SF | 2003-04 | 26 | TOR | 90 | 86 | 111 |
| Richard Jefferson | SF | 2011-12 | 31 | SAS/GSW | 90 | 93 | 162 |
| Rasual Butler | G/F | 2006-07 | 27 | NOK | 90 | 61 | 89 |
| Pat Garrity | SF | 2002-03 | 26 | ORL | 89 | 79 | 89 |
| Matt Carroll | SF | 2007-08 | 27 | CHA | 89 | 59 | 105 |
| Brandon Rush | SG | 2010-11 | 25 | IND | 89 | 66 | 106 |
| Quentin Richardson | SG | 2008-09 | 28 | NYK | 89 | 82 | 123 |
| Gordan Giricek | SF | 2003-04 | 26 | ORL | 88 | 71 | 99 |
| Ryan Gomes | SF | 2009-10 | 27 | MIN | 88 | 83 | 119 |
Webster will be out for a significant chunk of the season after back surgery during the summer. His list of similars is an unsurprising mix of role-playing G/F types. This group’s average peak was at age 26.7 — Webster is 28 and appears to have peaked at 26 (his first year in DC). The average peak PPA was 110 — barring a miraculous recovery, Webster’s was 114.
The guys on this list tended to decline a bit the following season, though not much. Assuming Webster gets healthy, it’s reasonable to expect him to play about as well as he did last season.
Just for those who might be interested, here are the “similars” for Trevor Ariza and Trevor Booker, the team’s significant free agent losses:
| PLAYER | POS | SEASON | AGE | TEAM | SIM SCORE | PPA SEASON | PPA PEAK |
| Trevor Ariza | SF | 2013-14 | 28 | WAS | 100 | 145 | 145 |
| Nick Anderson | SG | 1995-96 | 28 | ORL | 93 | 151 | 164 |
| Bryon Russell | SF | 1998-99 | 28 | UTA | 88 | 128 | 128 |
| Bryon Russell | SF | 1999-00 | 29 | UTA | 88 | 127 | 140 |
| Hersey Hawkins | G/F | 1995-96 | 29 | SEA | 88 | 148 | 173 |
| Kerry Kittles | SF | 2003-04 | 29 | NJN | 88 | 136 | 179 |
| Hersey Hawkins | SG | 1994-95 | 28 | CHH | 88 | 148 | 173 |
| Brent Barry | SG | 1999-00 | 28 | SEA | 87 | 132 | 183 |
| Dan Majerle | SG | 1992-93 | 27 | PHO | 87 | 133 | 135 |
| Wesley Person | SG | 1997-98 | 26 | CLE | 87 | 150 | 150 |
| Rashard Lewis | PF | 2007-08 | 28 | ORL | 87 | 138 | 165 |
| PLAYER | POS | SEASON | AGE | TEAM | SIM SCORE | PPA SEASON | PPA PEAK |
| Trevor Booker | PF | 2013-14 | 26 | WAS | 100 | 123 | 123 |
| Gustavo Ayon | PF | 2011-12 | 26 | NOH | 90 | 134 | 134 |
| Luc Mbah a Moute | PF | 2011-12 | 25 | MIL | 90 | 106 | 106 |
| Chucky Brown | PF | 1995-96 | 27 | HOU | 90 | 117 | 117 |
| Kent Benson | C | 1983-84 | 29 | DET | 89 | 119 | 137 |
| Ben Poquette | PF | 1981-82 | 26 | UTA | 89 | 100 | 106 |
| Rasho Nesterovic | C | 2006-07 | 30 | TOR | 89 | 120 | 140 |
| Tyrone Corbin | SF | 1988-89 | 26 | PHO | 89 | 110 | 126 |
| Nenad Krstic | C | 2009-10 | 26 | OKC | 89 | 107 | 118 |
| Jason Thompson | PF | 2011-12 | 25 | SAC | 89 | 130 | 130 |
| Olden Polynice | C | 1991-92 | 27 | LAC | 89 | 114 | 127 |
And finally, here’s the “All-Sims” team, so to speak. The method here is to take the guy from the top of each player’s list:
| POS | Wizards | Similars |
| PG | John Wall | Kemba Walker |
| SG | Bradley Beal | Brandon Jennings |
| SF | Paul Pierce | Toni Kukoc |
| PF | Nenê | Danny Manning |
| C | Marcin Gortat | Bill Laimbeer |
| BENCH | ||
| PG | Andre Miller | Rod Strickland |
| SG | Martell Webster | Keith Bogans |
| SF | Otto Porter | Lance Stephenson |
| PF | Kris Humphries | Chris Wilcox |
| C | DeJuan Blair | Dennis Rodman |
| G/F | Glen Rice Jr. | Scott Padgett |
| G/F | Rasual Butler | Steve Kerr |
| C | Kevin Seraphin | Stanislav Medvedenko |
| THE DEPARTED | ||
| SF | Trevor Ariza | Nick Anderson |
| PF | Trevor Booker | Gustavo Ayon |